Note
Click here to download the full example code
Long short-term memory (LSTM) networks
Hello world
import numpy as np
import matplotlib.pyplot as plt

from mpl_toolkits.mplot3d import Axes3D
from tensorflow.keras.models import Sequential
from tensorflow.keras.layers import LSTM, Bidirectional, Dense, RepeatVector, TimeDistributed
num_seqs = 5
seq_len = 25
num_features = 1

seed = 42  # set random seed for reproducibility
random_state = np.random.RandomState(seed)
Many-to-many LSTM
# generate random walks in Euclidean space
inputs = np.cumsum(random_state.randn(num_seqs, seq_len, num_features), axis=1)
lstm = LSTM(units=1, return_sequences=True)
output = lstm(inputs)
print(output.shape)
Out:
(5, 25, 1)
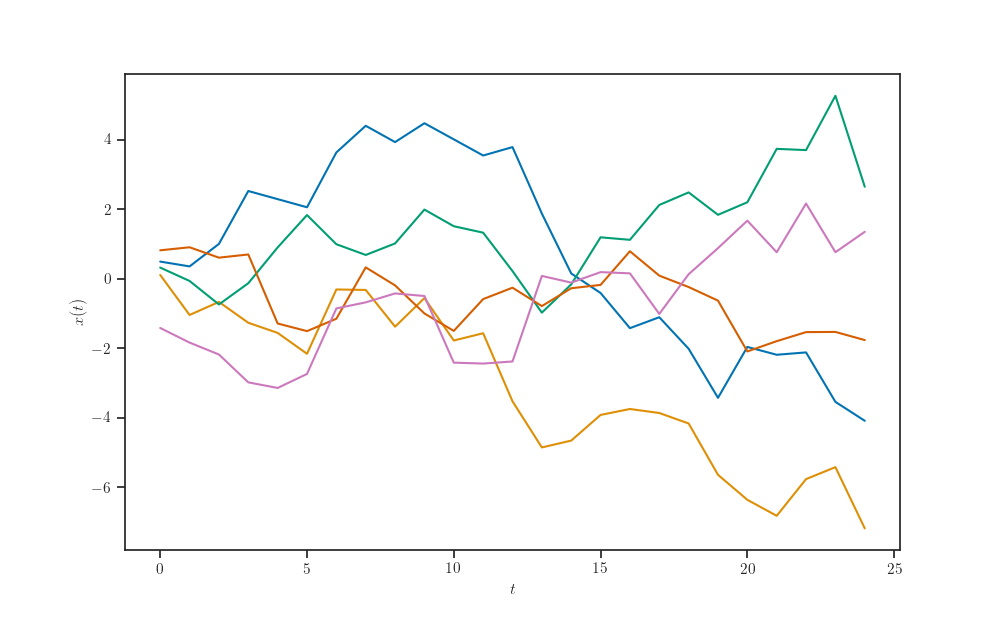
fig, ax = plt.subplots()

ax.plot(inputs[..., 0].T)

ax.set_xlabel(r"$t$")
ax.set_ylabel(r"$x(t)$")

plt.show()

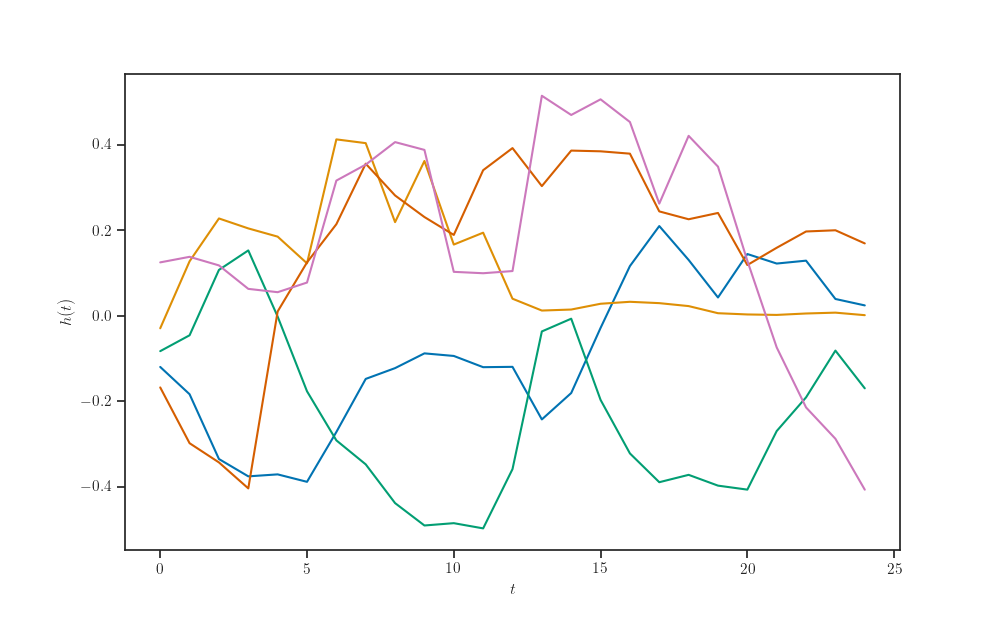
fig, ax = plt.subplots()

ax.plot(output.numpy()[..., 0].T)

ax.set_xlabel(r"$t$")
ax.set_ylabel(r"$h(t)$")

plt.show()

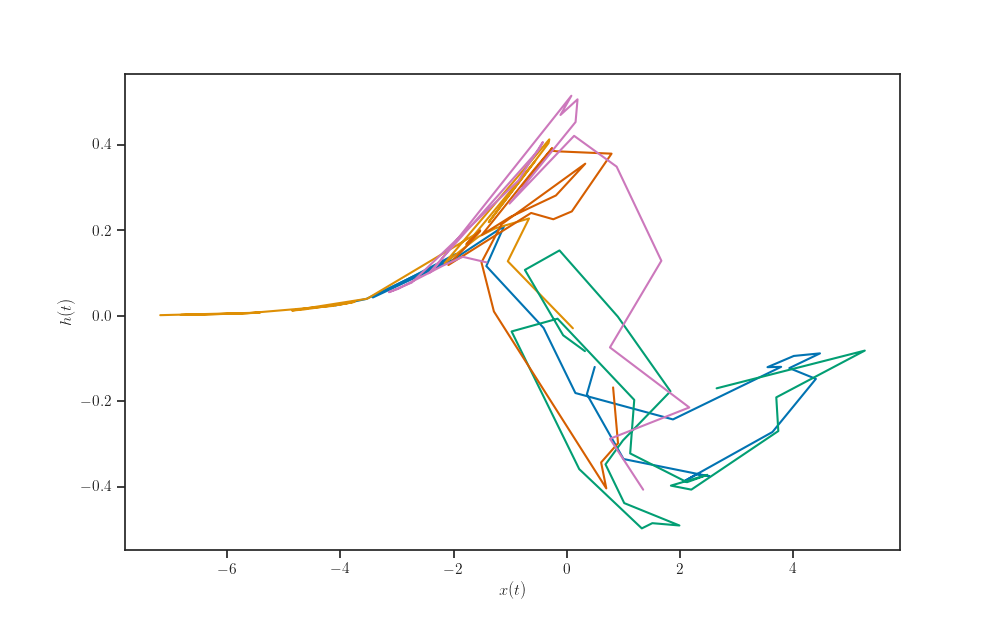
fig, ax = plt.subplots()

ax.plot(inputs[..., 0].T,
        output.numpy()[..., 0].T)

ax.set_xlabel(r"$x(t)$")
ax.set_ylabel(r"$h(t)$")

plt.show()

One-to-many LSTM
seq_len = 100
num_index_points = 128
xmin, xmax = -10.0, 10.0
X_grid = np.linspace(xmin, xmax, num_index_points).reshape(-1, num_features)
model = Sequential([
    RepeatVector(seq_len, input_shape=(num_features,)),
    Bidirectional(LSTM(units=32, return_sequences=True), merge_mode="concat"),
    TimeDistributed(Dense(1))
])
model.summary()
Out:
Model: "sequential_5"
_________________________________________________________________
Layer (type)                 Output Shape              Param #
=================================================================
repeat_vector (RepeatVector) (None, 100, 1)            0
_________________________________________________________________
bidirectional (Bidirectional (None, 100, 64)           8704
_________________________________________________________________
time_distributed (TimeDistri (None, 100, 1)            65
=================================================================
Total params: 8,769
Trainable params: 8,769
Non-trainable params: 0
_________________________________________________________________
Z = model(X_grid)
Z
Out:
<tf.Tensor: shape=(128, 100, 1), dtype=float32, numpy=
array([[[-0.18354933],
        [-0.30141646],
        [-0.37728903],
        ...,
        [-0.33238253],
        [-0.30502355],
        [-0.28547618]],

       [[-0.17893629],
        [-0.29478052],
        [-0.36996403],
        ...,
        [-0.32376558],
        [-0.29686114],
        [-0.2786622 ]],

       [[-0.17418236],
        [-0.28793848],
        [-0.3623963 ],
        ...,
        [-0.31536895],
        [-0.28893828],
        [-0.27210516]],

       ...,

       [[-0.6189441 ],
        [-0.6935143 ],
        [-0.72257364],
        ...,
        [-0.6948264 ],
        [-0.63015556],
        [-0.5438851 ]],

       [[-0.61907387],
        [-0.6935504 ],
        [-0.7228407 ],
        ...,
        [-0.6987864 ],
        [-0.63389534],
        [-0.54702204]],

       [[-0.6191223 ],
        [-0.6934863 ],
        [-0.7229916 ],
        ...,
        [-0.70253503],
        [-0.63743615],
        [-0.5499795 ]]], dtype=float32)>
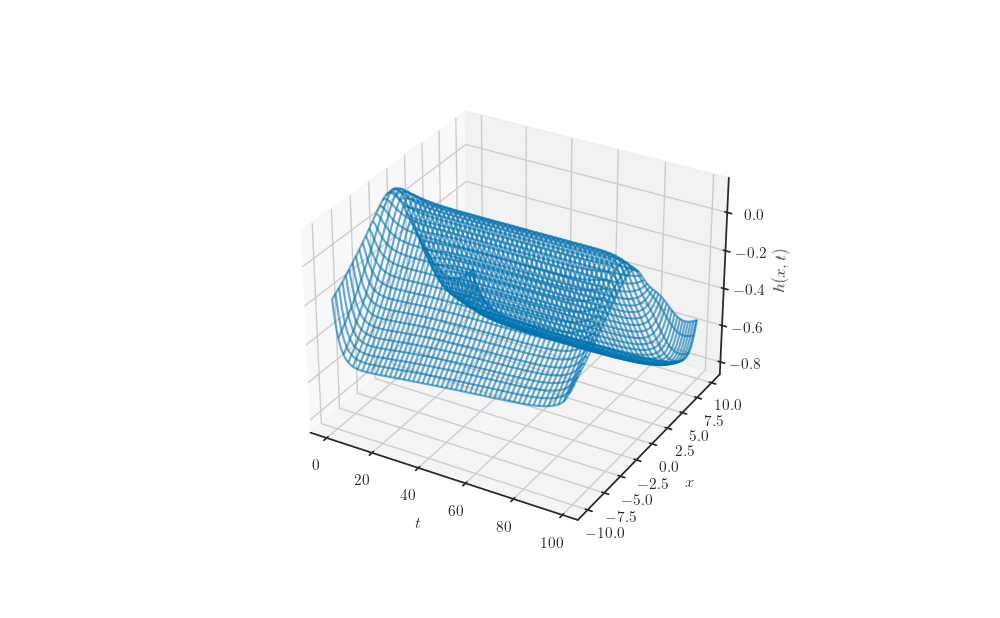
T_grid = np.arange(seq_len)

fig, ax = plt.subplots(subplot_kw=dict(projection="3d"))

ax.plot_wireframe(T_grid, X_grid, Z.numpy().squeeze(axis=-1), alpha=0.6)
# ax.plot_surface(T_grid, X_grid, Z.numpy().squeeze(axis=-1),
#                 edgecolor='k', linewidth=0.5, cmap="Spectral_r")

ax.set_xlabel(r'$t$')
ax.set_ylabel(r'$x$')
ax.set_zlabel(r"$h(x, t)$")

plt.show()

Total running time of the script: ( 0 minutes 4.398 seconds)