Note
Click here to download the full example code
Learning curves (learning rate)
Hello world
import numpy as np
import pandas as pd

import matplotlib.pyplot as plt
import seaborn as sns

from tensorflow.keras.models import Sequential
from tensorflow.keras.layers import Dense
from tensorflow.keras.optimizers import Adam
from tensorflow.keras.initializers import GlorotUniform

from sklearn.datasets import load_boston
from sklearn.model_selection import train_test_split

from matplotlib.colors import LogNorm
from mpl_toolkits.mplot3d import Axes3D

from etudes.metrics import nmse
num_index_points = 64

num_layers = 3
num_units = 32

num_epochs = 100
batch_size = 64

val_rate = 0.2

seed = 8888  # set random seed for reproducibility
random_state = np.random.RandomState(seed)
t_grid = np.arange(num_epochs)

# lr_grid = np.logspace(-5, -0.5, num_index_points)
log_lr_grid = np.linspace(-5.0, -1.0, num_index_points)
lr_grid = 10**log_lr_grid
dataset = load_boston()
X_train, X_val, y_train, y_val = train_test_split(dataset.data, dataset.target,
                                                  test_size=val_rate,
                                                  random_state=random_state)
frames = []

for i, lr in enumerate(lr_grid):

    optimizer = Adam(learning_rate=lr)

    model = Sequential()
    for _ in range(num_layers):
        model.add(Dense(num_units, activation="relu",
                        kernel_initializer=GlorotUniform(seed=seed)))
    model.add(Dense(1, kernel_initializer=GlorotUniform(seed=seed)))

    model.compile(optimizer=optimizer, loss="mean_squared_error", metrics=[nmse])
    hist = model.fit(X_train, y_train, validation_data=(X_val, y_val),
                     epochs=num_epochs, batch_size=batch_size, verbose=False)

    frame = pd.DataFrame(hist.history).assign(log_lr=log_lr_grid[i], seed=seed)
    frame.index.name = "epoch"
    frame.reset_index(inplace=True)
    frames.append(frame)
data = pd.concat(frames, axis="index", ignore_index=True, sort=True)
data.rename(lambda s: s.replace('_', ' '), axis="columns", inplace=True)
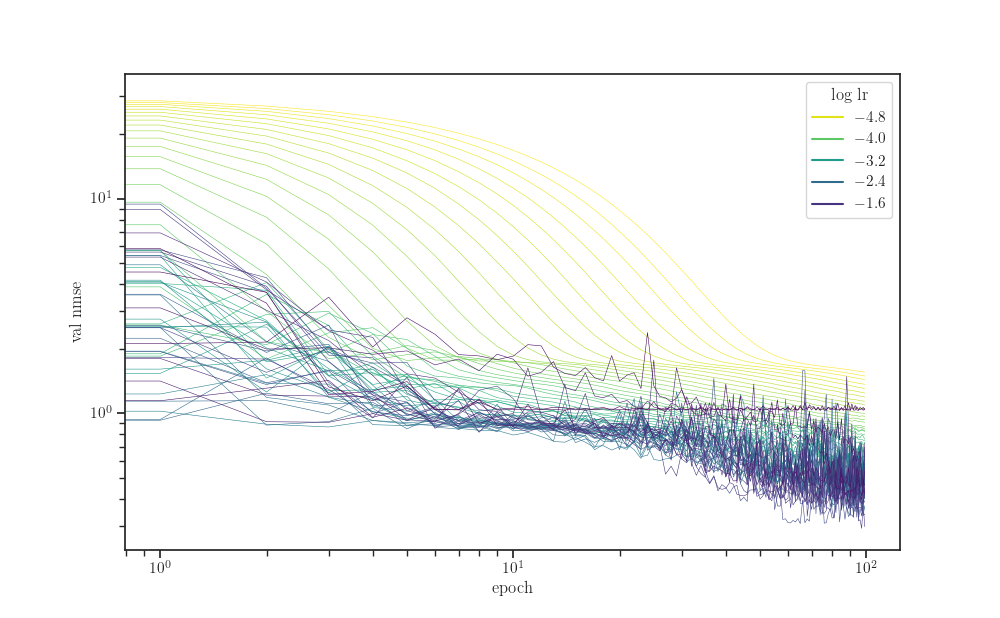
fig, ax = plt.subplots()

sns.lineplot(x="epoch", y="val nmse", hue="log lr",
             units="seed", estimator=None,
             palette="viridis_r", linewidth=0.4,
             data=data, ax=ax)

ax.set_xscale("log")
ax.set_yscale("log")

plt.show()
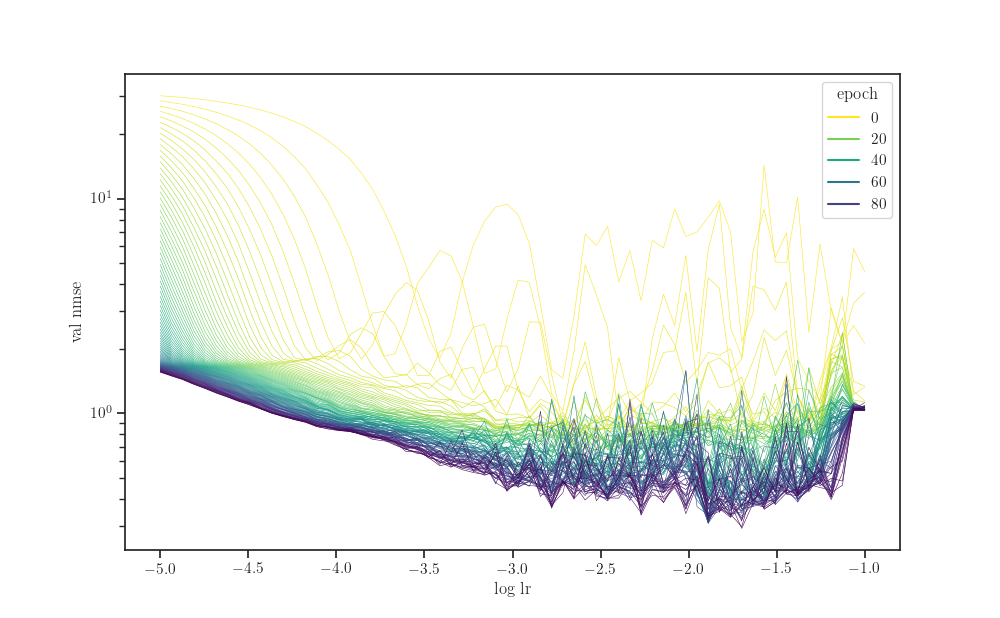
fig, ax = plt.subplots()

sns.lineplot(x="log lr", y="val nmse", hue="epoch",
             units="seed", estimator=None,
             palette="viridis_r", linewidth=0.4,
             data=data, ax=ax)

ax.set_yscale("log")

plt.show()
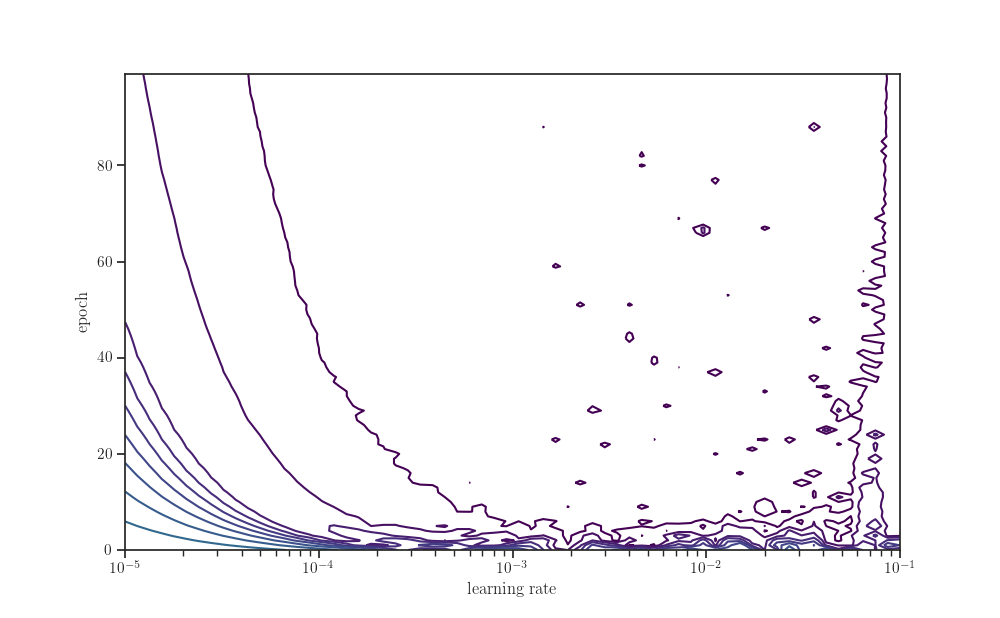
new_data = data.pivot(index="log lr", columns="epoch", values="val nmse")
Z = new_data.to_numpy()
fig, ax = plt.subplots()

ax.contour(*np.broadcast_arrays(lr_grid.reshape(-1, 1), t_grid), Z,
           levels=np.logspace(0, 4, 25), norm=LogNorm(), cmap="viridis")

ax.set_xscale("log")

ax.set_xlabel(r"learning rate")
ax.set_ylabel(r"epoch")

plt.show()
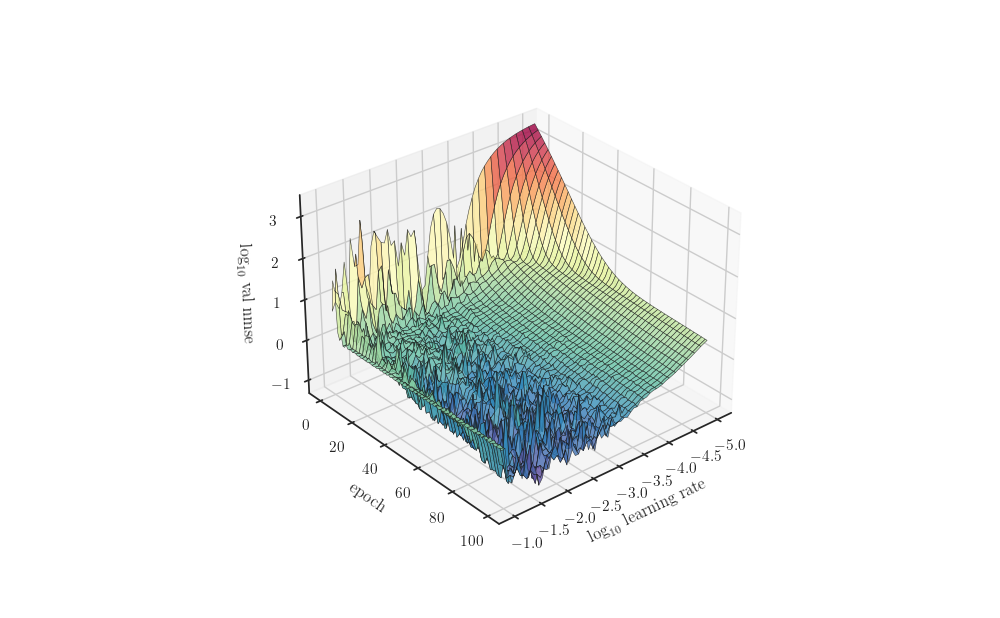
fig, ax = plt.subplots(subplot_kw=dict(projection="3d", azim=50))

ax.plot_surface(log_lr_grid.reshape(-1, 1), t_grid, np.log(Z), alpha=0.8,
                edgecolor='k', linewidth=0.4, cmap="Spectral_r")

ax.set_xlabel(r"$\log_{10}$ learning rate")
ax.set_ylabel("epoch")
ax.set_zlabel(r"$\log_{10}$ val nmse")

plt.show()
new_data.rename(lambda s: s + 1, axis="columns", inplace=True)
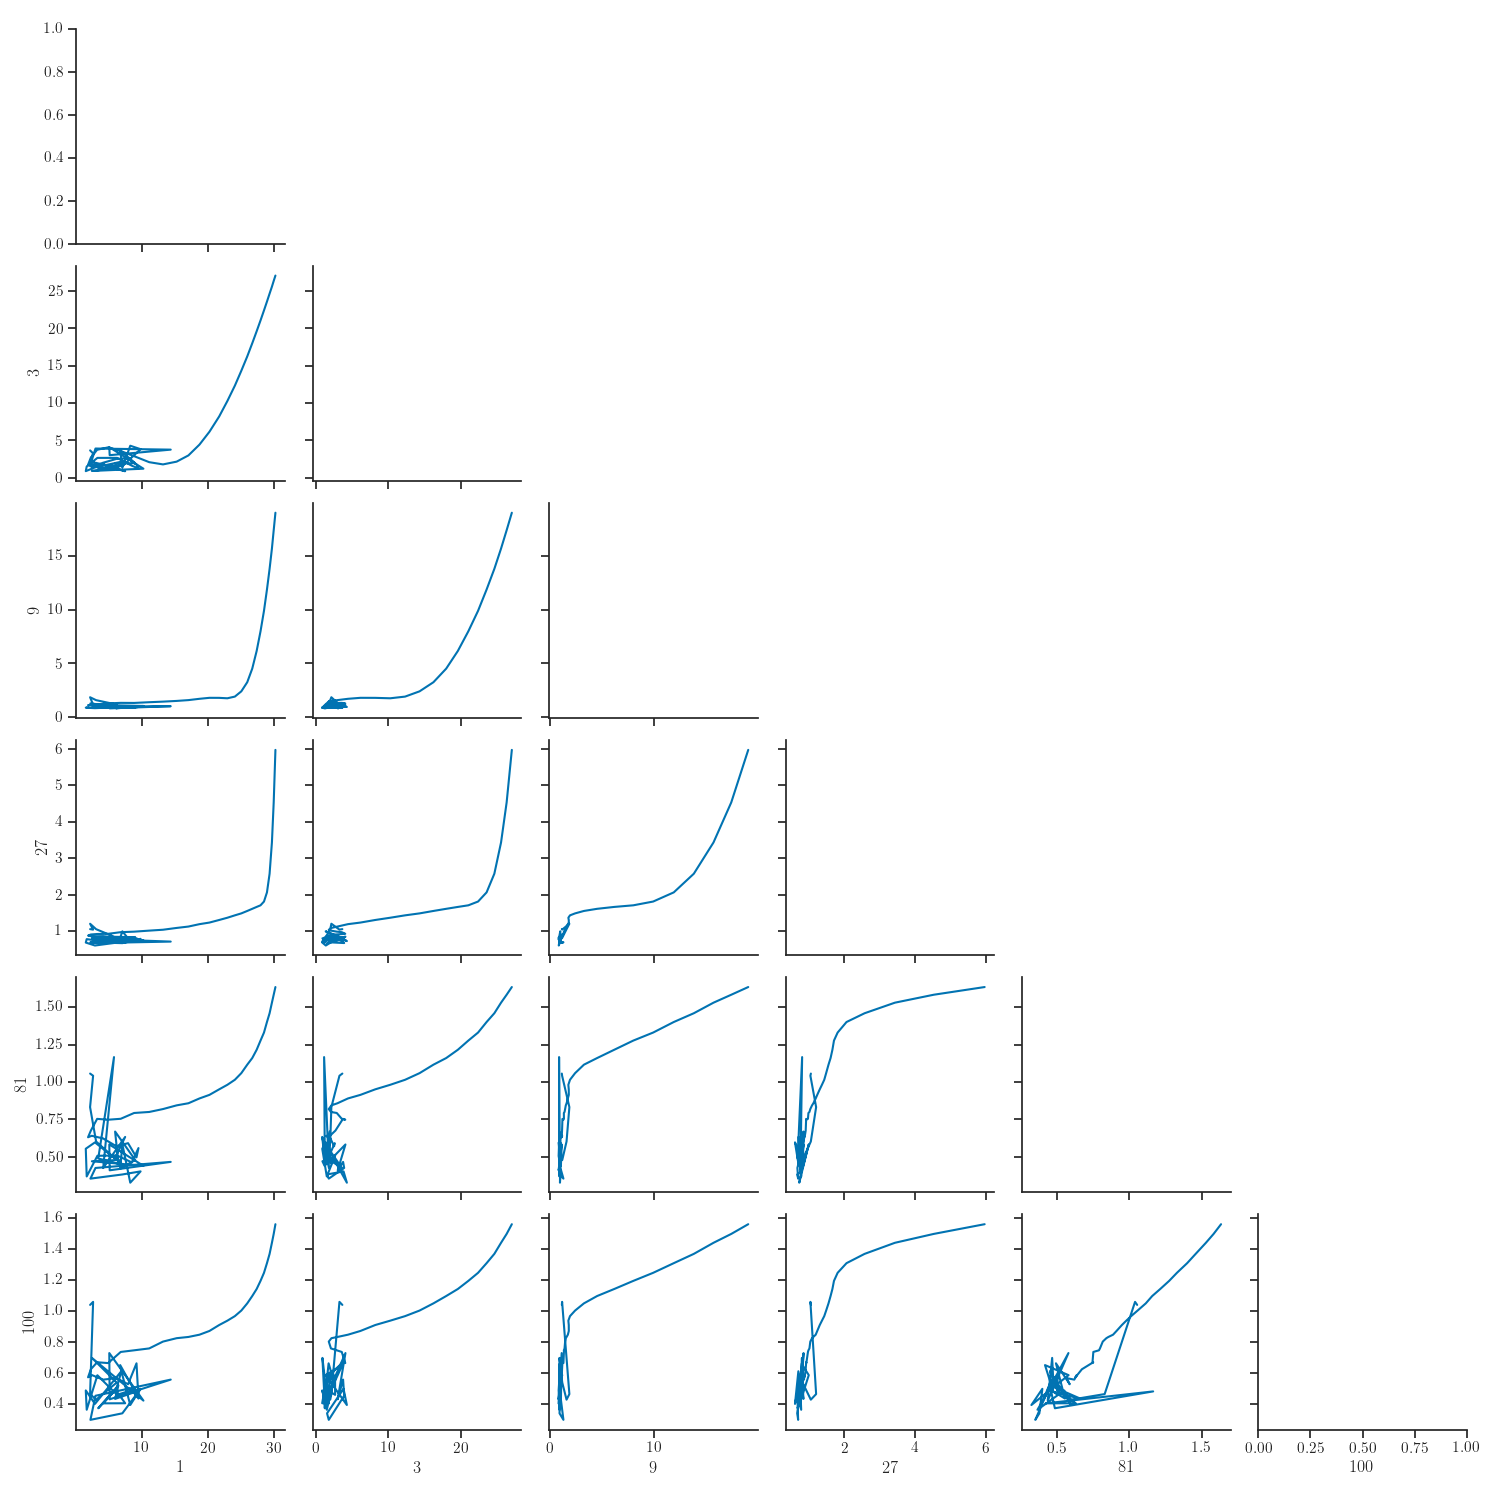
columns = list(np.minimum(3**np.arange(6), num_epochs))
g = sns.PairGrid(new_data[columns], corner=True)
g = g.map_lower(plt.plot)
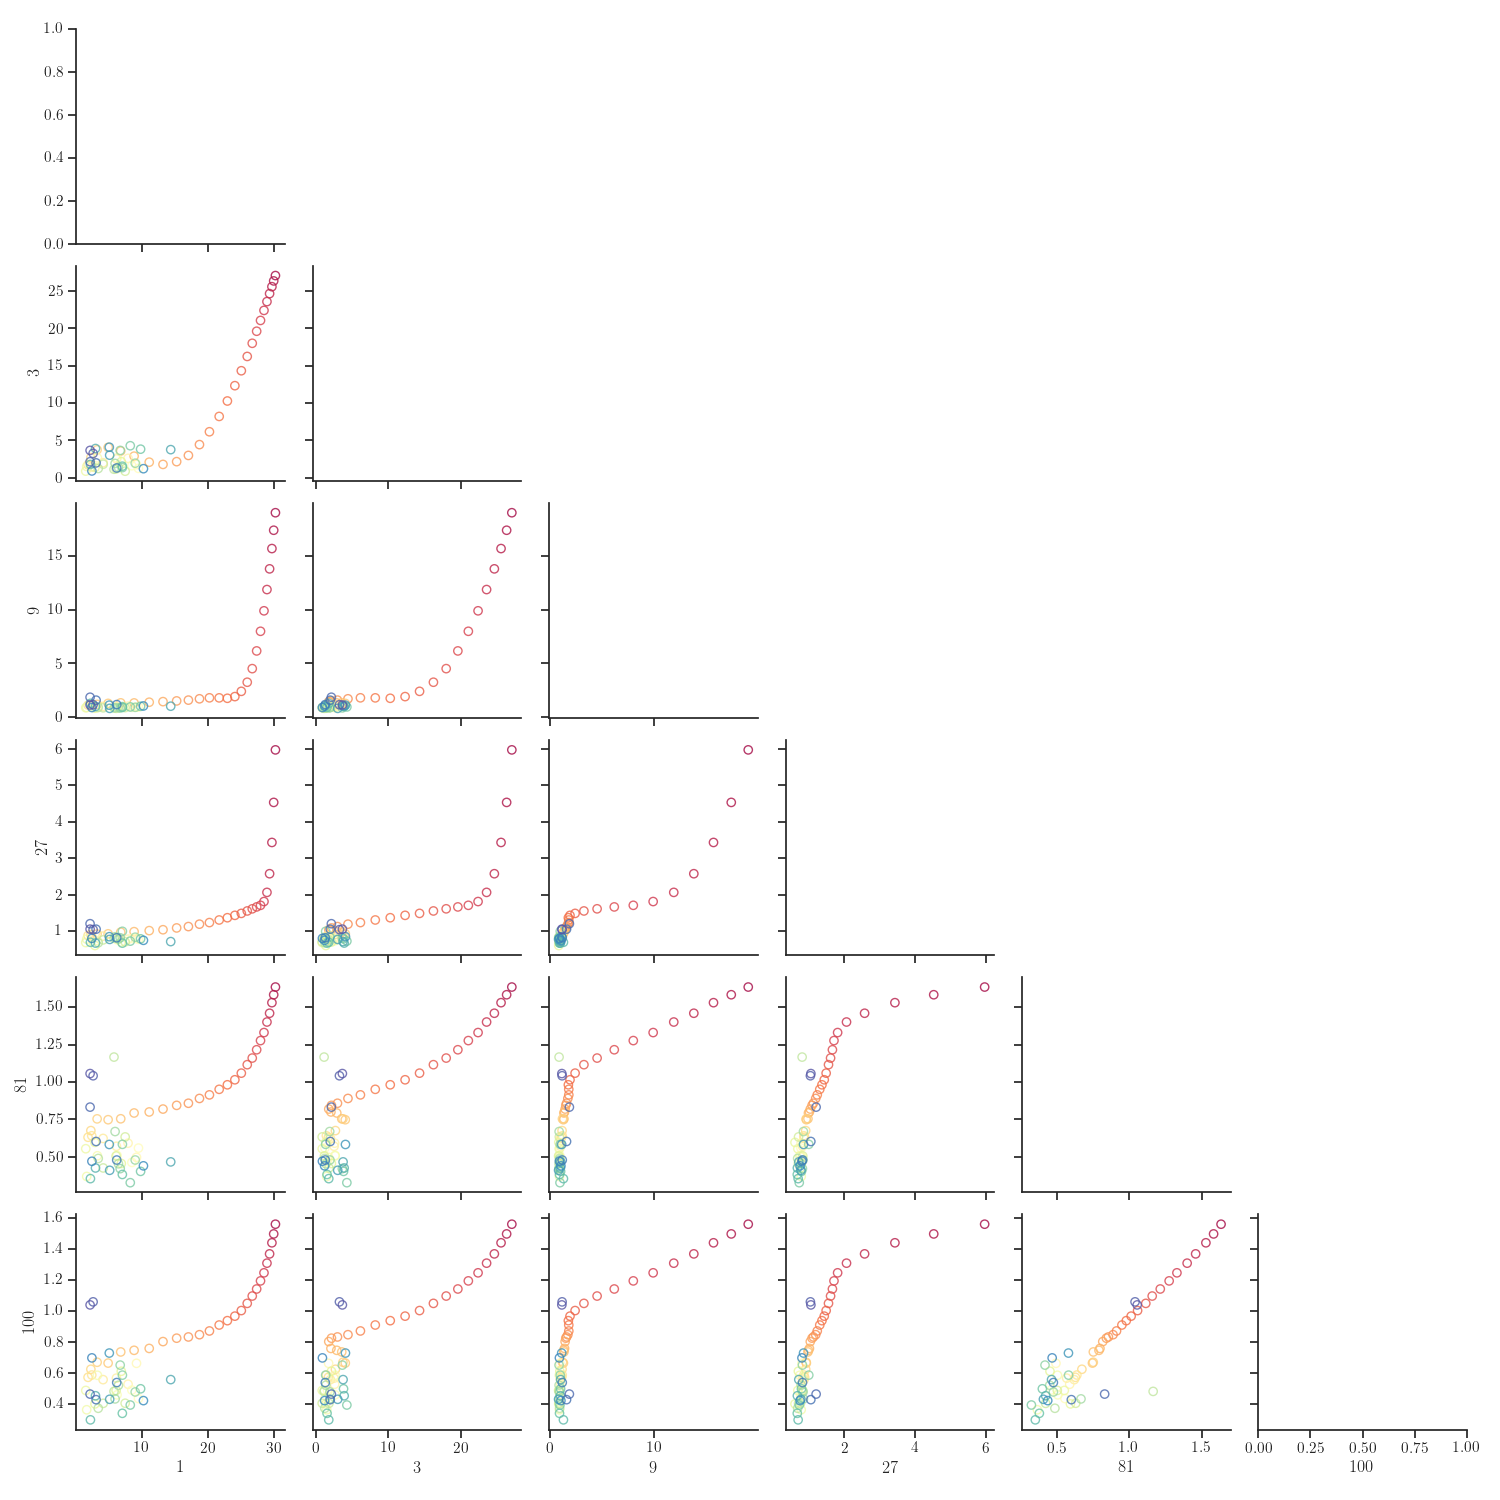
g = sns.PairGrid(new_data[columns].reset_index(),
                 hue="log lr", palette="Spectral", corner=True)
g = g.map_lower(plt.scatter, facecolor="none", alpha=0.8)
Total running time of the script: ( 2 minutes 55.205 seconds)