Note
Click here to download the full example code
Divergence estimation with Gauss-Hermite Quadrature
Hello world
import numpy as np

import tensorflow as tf
import tensorflow_probability as tfp

import matplotlib.pyplot as plt
import seaborn as sns
import pandas as pd

tfd = tfp.distributions

max_size = 300
num_seeds = 10

x_min, x_max = -15.0, 15.0

num_query_points = 256
num_features = 1

# query index points
X_pred = np.linspace(x_min, x_max, num_query_points)
Example
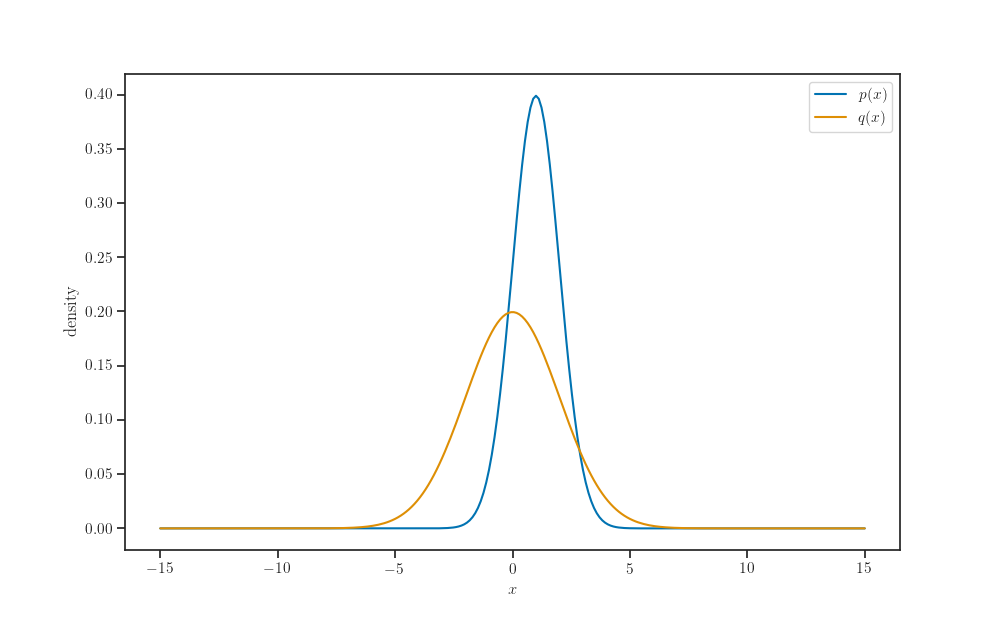
p = tfd.Normal(loc=1.0, scale=1.0)
q = tfd.Normal(loc=0.0, scale=2.0)
fig, ax = plt.subplots()

ax.plot(X_pred, p.prob(X_pred), label='$p(x)$')
ax.plot(X_pred, q.prob(X_pred), label='$q(x)$')

ax.set_xlabel('$x$')
ax.set_ylabel('density')

ax.legend()

plt.show()
Exact KL divergence (analytical)
kl_exact = tfd.kl_divergence(p, q).numpy()
kl_exact
Out:
0.44314718
Approximate KL divergence (Monte Carlo)
sample_size = 25
seed = 8888
kl_monte_carlo = tfp.vi.monte_carlo_variational_loss(
    p.log_prob, q, sample_size=sample_size,
    discrepancy_fn=tfp.vi.kl_forward, seed=seed).numpy()
kl_monte_carlo
Out:
0.326479
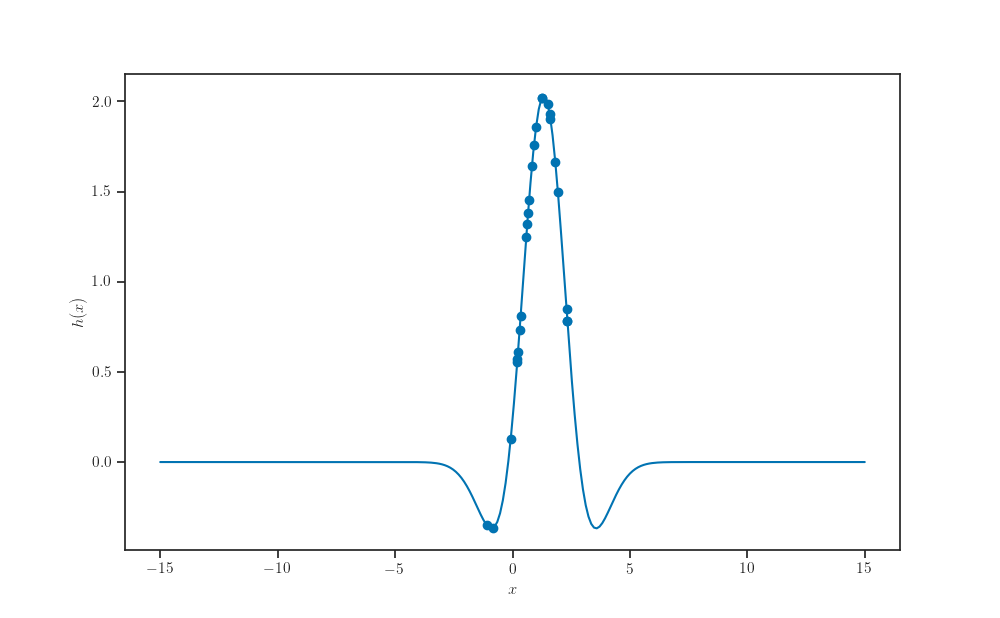
x_samples = p.sample(sample_size, seed=seed)
def log_ratio(x):
    return p.log_prob(x) - q.log_prob(x)


def h(x):
    return tfp.vi.kl_forward(log_ratio(x))
fig, ax = plt.subplots()

ax.plot(X_pred, h(X_pred))
ax.scatter(x_samples, h(x_samples))

ax.set_xlabel(r'$x$')
ax.set_ylabel(r'$h(x)$')

plt.show()
def divergence_monte_carlo(p, q, sample_size, under_p=True,
                           discrepancy_fn=tfp.vi.kl_forward, seed=None):

    def log_ratio(x):
        return p.log_prob(x) - q.log_prob(x)

    if under_p:

        # TODO: Raise exception if `p` is non-Gaussian.
        w = lambda x: tf.exp(-log_ratio(x))
        dist = p

    else:

        # TODO: Raise exception if `q` is non-Gaussian.
        w = lambda x: 1.0
        dist = q

    def fn(x):
        return w(x) * discrepancy_fn(log_ratio(x))

    x_samples = dist.sample(sample_size, seed=seed)

    # same as:
    # return tfp.monte_carlo.expectation(f=fn, samples=x_samples)
    return tf.reduce_mean(fn(x_samples), axis=-1)
divergence_monte_carlo(p, q, sample_size, under_p=False, seed=seed).numpy()
Out:
0.74457335
Approximate KL divergence (Gauss-Hermite Quadrature)
Consider a function \(f(x)\) where the variable \(x\) is normally distributed \(x \sim p(x) = \mathcal{N}(\mu, \sigma^2)\). Then, to evaluate the expectaton of $f$, we can apply the change-of-variables
\[z = \frac{x - \mu}{\sqrt{2}\sigma} \Leftrightarrow \sqrt{2}\sigma z + \mu,\]
and use Gauss-Hermite quadrature, which leads to
\[\begin{split}\mathbb{E}_{p(x)}[f(x)]
& = \int \frac{1}{\sigma \sqrt{2\pi}}
\exp \left ( -\frac{(x - \mu)^2}{2\sigma^2} \right ) f(x) dx \\
& = \frac{1}{\sqrt{\pi}} \int
\exp ( - z^2 ) f(\sqrt{2}\sigma z + \mu) dz \\
& \approx \frac{1}{\sqrt{\pi}} \sum_{i=1}^{m} w_i f(\sqrt{2}\sigma z_i + \mu)\end{split}\]
where we’ve used integration by substitution with \(dx = \sqrt{2} \sigma dz\).
quadrature_size = 25
def transform(x, loc, scale):

    return np.sqrt(2) * scale * x + loc


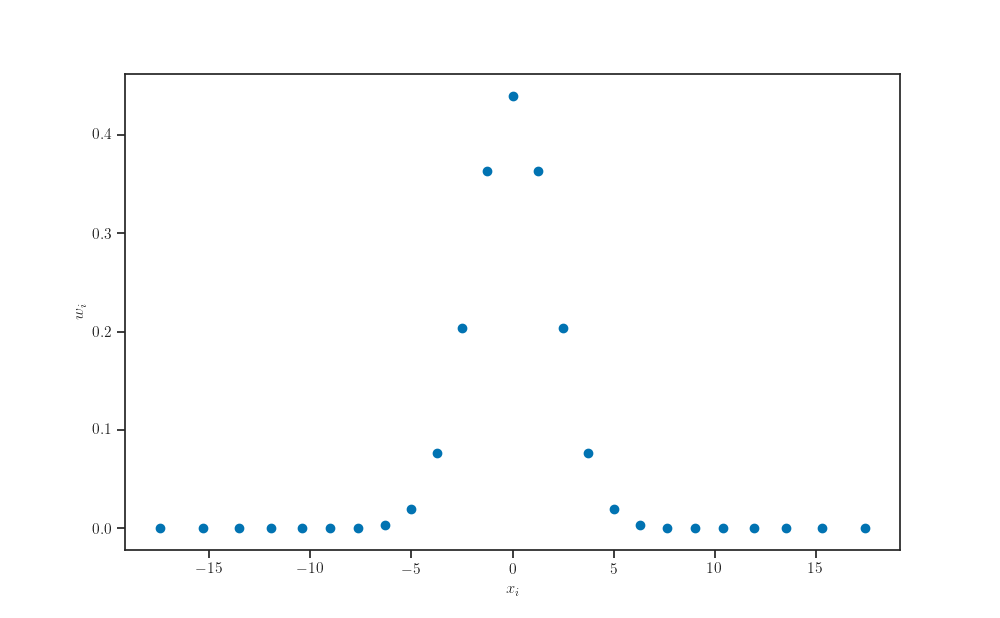
X_samples, weights = np.polynomial.hermite.hermgauss(quadrature_size)
fig, ax = plt.subplots()

ax.scatter(transform(X_samples, q.loc, q.scale), weights)
ax.set_xlabel(r'$x_i$')
ax.set_ylabel(r'$w_i$')

plt.show()
fig, ax = plt.subplots()

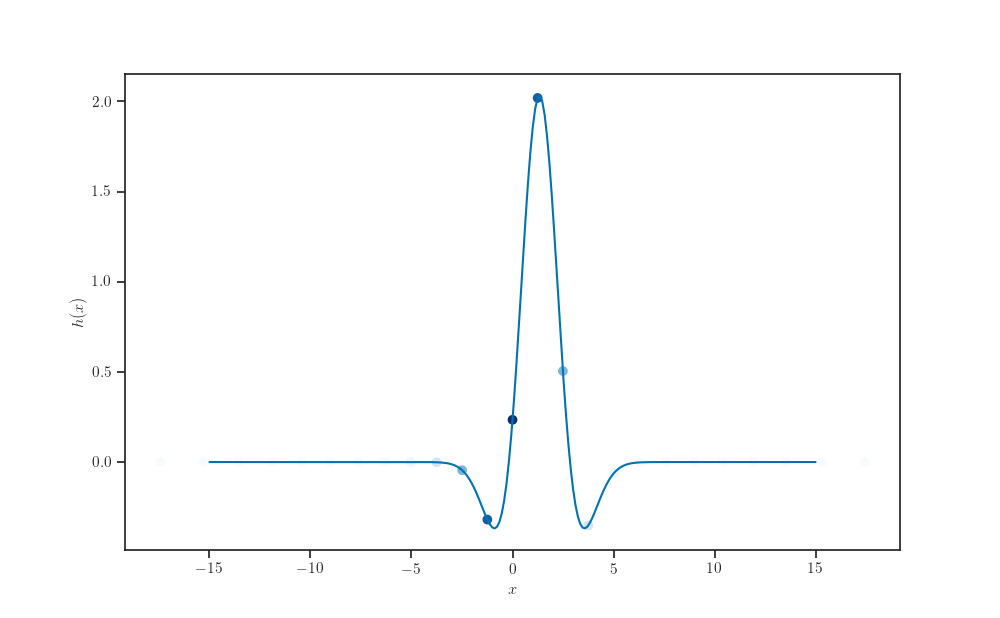
ax.plot(X_pred, h(X_pred))
ax.scatter(transform(X_samples, q.loc, q.scale),
           h(transform(X_samples, q.loc, q.scale)),
           c=weights, cmap="Blues")

ax.set_xlabel(r'$x$')
ax.set_ylabel(r'$h(x)$')

plt.show()
def expectation_gauss_hermite(fn, normal, quadrature_size):

    x, weights = np.polynomial.hermite.hermgauss(quadrature_size)
    y = transform(x, normal.loc, normal.scale)

    return tf.reduce_sum(weights * fn(y), axis=-1) / tf.sqrt(np.pi)


def divergence_gauss_hermite(p, q, quadrature_size, under_p=True,
                             discrepancy_fn=tfp.vi.kl_forward):
    """
    Compute D_f[p || q]
        = E_{q(x)}[f(p(x)/q(x))]
        = E_{p(x)}[r(x)^{-1} f(r(x))]          -- r(x) = p(x)/q(x)
        = E_{p(x)}[exp(-log r(x)) g(log r(x))] -- g(.) = f(exp(.))
        = E_{p(x)}[h(x)]                       -- h(x) = exp(-log r(x)) g(log r(x))
    using Gauss-Hermite quadrature assuming p(x) is Gaussian.
    Note `discrepancy_fn` corresponds to function `g`.
    """
    def log_ratio(x):
        return p.log_prob(x) - q.log_prob(x)

    if under_p:

        # TODO: Raise exception if `p` is non-Gaussian.
        w = lambda x: tf.exp(-log_ratio(x))
        normal = p

    else:

        # TODO: Raise exception if `q` is non-Gaussian.
        w = lambda x: 1.0
        normal = q

    def fn(x):
        return w(x) * discrepancy_fn(log_ratio(x))

    return expectation_gauss_hermite(fn, normal, quadrature_size)
divergence_gauss_hermite(p, q, quadrature_size, under_p=False).numpy()
Out:
0.44317514
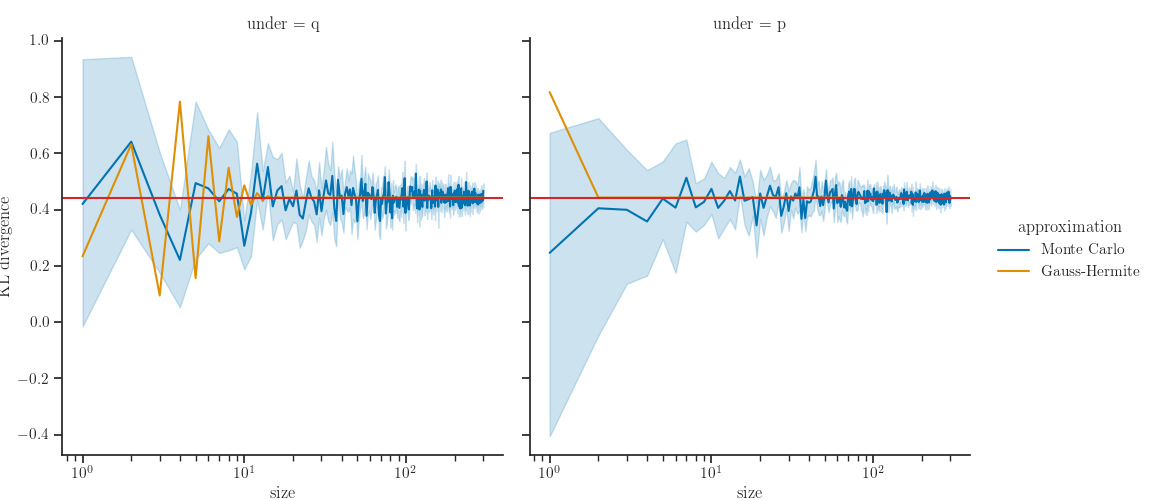
Comparisons
lst = []

for size in range(1, max_size+1):

    for under_p in range(2):

        under_p = bool(under_p)

        for seed in range(num_seeds):

            kl = divergence_monte_carlo(p, q, size, under_p=under_p,
                                        seed=seed).numpy()
            lst.append(dict(kl=kl, size=size, seed=seed,
                            under="p" if under_p else "q",
                            approximation="Monte Carlo"))

        kl = divergence_gauss_hermite(p, q, size, under_p=under_p).numpy()
        lst.append(dict(kl=kl, size=size, seed=0,
                        under="p" if under_p else "q",
                        approximation="Gauss-Hermite"))

data = pd.DataFrame(lst)
Results
def axhline(*args, **kwargs):

    ax = plt.gca()
    ax.axhline(kl_exact, color="tab:red", label="Exact")


g = sns.relplot(x="size", y="kl", hue="approximation",
                col="under", kind="line", data=data)
g.map(axhline)
g.set(xscale="log")
g.set_axis_labels("size", "KL divergence")
Out:
<seaborn.axisgrid.FacetGrid object at 0x7fe60946a6a0>
Total running time of the script: ( 0 minutes 28.852 seconds)