Note
Click here to download the full example code
Gaussian Process with Period Kernels
A look at periodic kernels.
import numpy as np
import tensorflow_probability as tfp

import matplotlib.pyplot as plt
import seaborn as sns

from etudes.gaussian_process import gp_sample_custom, dataframe_from_gp_samples
# shortcuts
tfd = tfp.distributions
kernels = tfp.math.psd_kernels

# constants
num_features = 1  # dimensionality
num_index_points = 256  # nbr of index points
num_samples = 8

x_min, x_max = -np.pi, np.pi
period = np.float64(2. * np.pi)
X_grid = np.linspace(x_min, x_max, num_index_points).reshape(-1, num_features)

seed = 23  # set random seed for reproducibility
random_state = np.random.RandomState(seed)

kernel_cls = kernels.ExpSinSquared
kernel = kernel_cls(period=period)
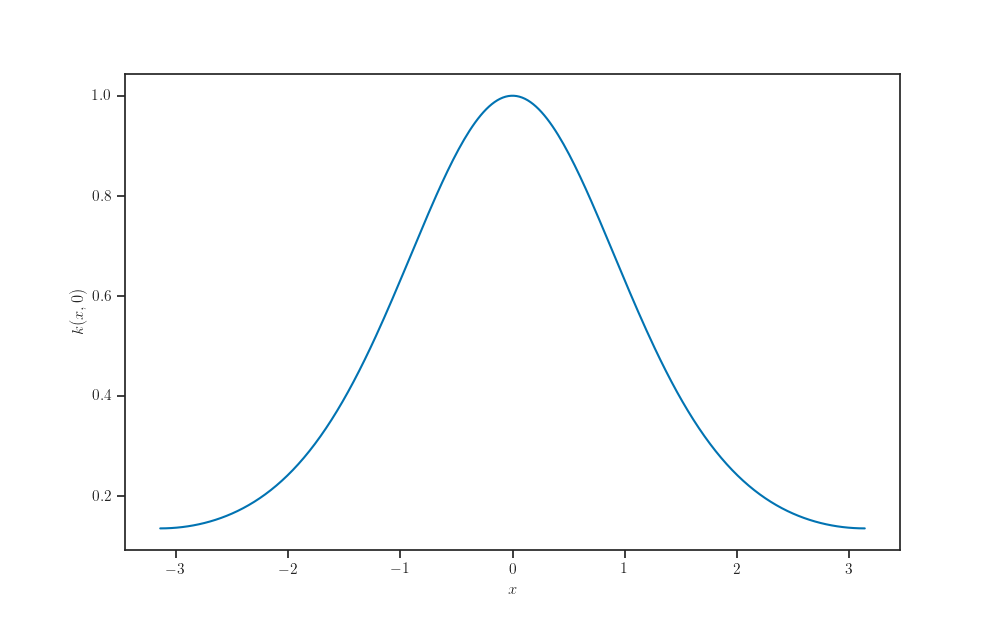
Kernel profile
The exponentiated quadratic kernel is stationary. That is, \(k(x, x') = k(x, 0)\) for all \(x, x'\).
fig, ax = plt.subplots()

ax.plot(X_grid, kernel.apply(X_grid, np.zeros((1, num_features))))

ax.set_xlabel(r'$x$')
ax.set_ylabel(r'$k(x, 0)$')

plt.show()
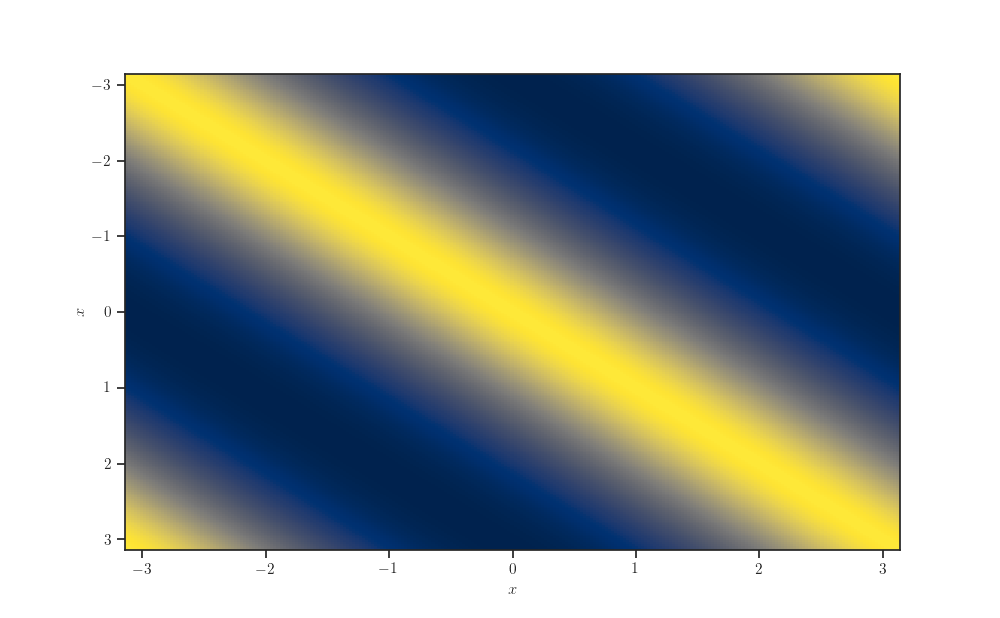
Kernel matrix
fig, ax = plt.subplots()

ax.pcolormesh(*np.broadcast_arrays(X_grid, X_grid.T),
              kernel.matrix(X_grid, X_grid), cmap="cividis")
ax.invert_yaxis()

ax.set_xlabel(r'$x$')
ax.set_ylabel(r'$x$')

plt.show()
Out:
/usr/src/app/examples/gaussian_processes/plot_periodic_kernel.py:59: MatplotlibDeprecationWarning: shading='flat' when X and Y have the same dimensions as C is deprecated since 3.3.  Either specify the corners of the quadrilaterals with X and Y, or pass shading='auto', 'nearest' or 'gouraud', or set rcParams['pcolor.shading'].  This will become an error two minor releases later.
  kernel.matrix(X_grid, X_grid), cmap="cividis")
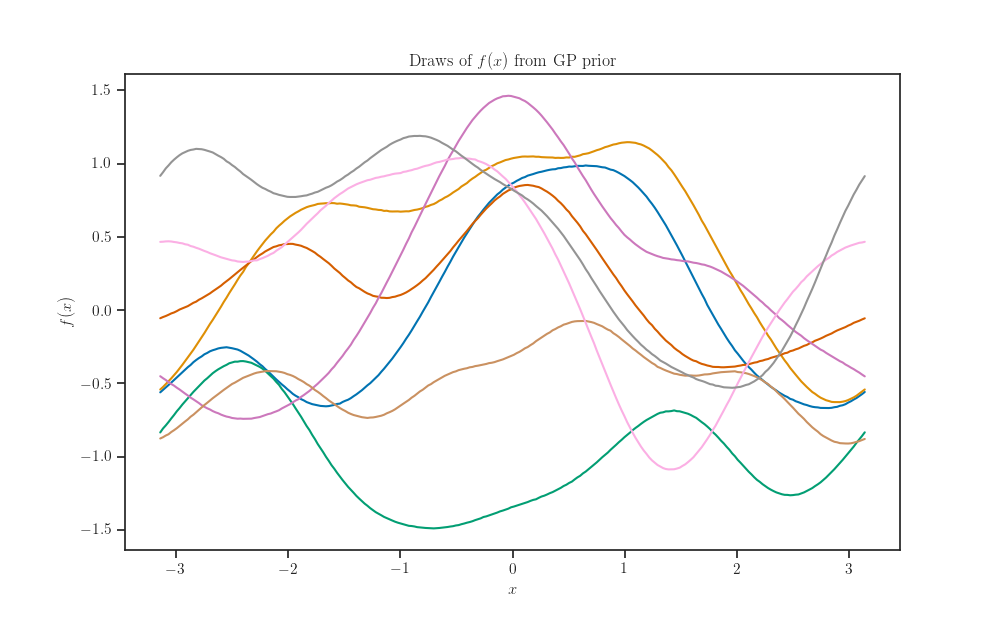
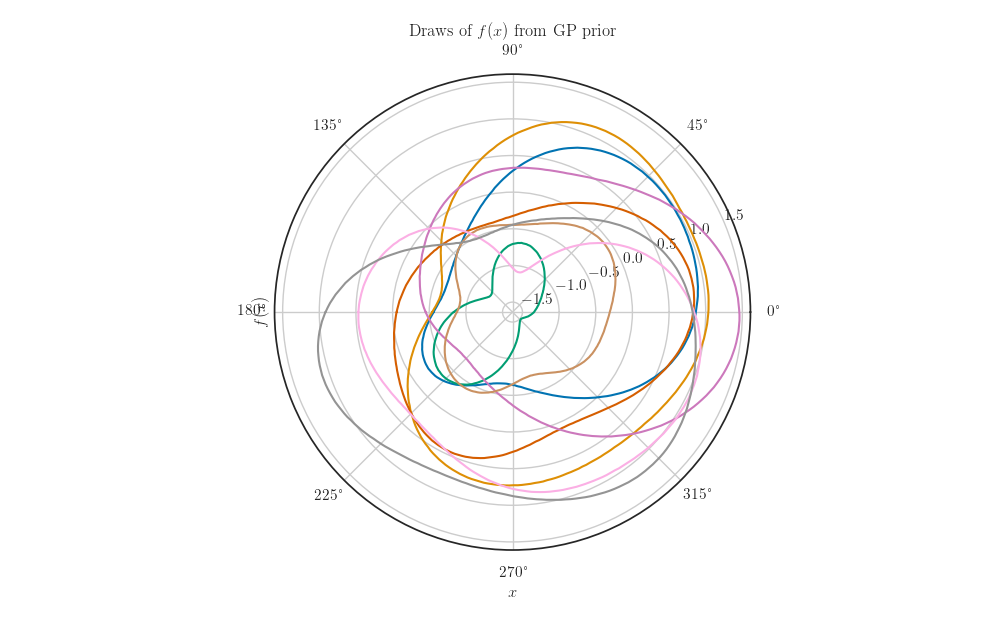
Prior samples
gp = tfd.GaussianProcess(kernel=kernel, index_points=X_grid)
samples = gp.sample(num_samples, seed=seed)
fig, ax = plt.subplots()

ax.plot(X_grid, samples.numpy().T)

ax.set_xlabel(r'$x$')
ax.set_ylabel(r'$f(x)$')
ax.set_title(r'Draws of $f(x)$ from GP prior')

plt.show()
fig, ax = plt.subplots(subplot_kw=dict(projection='polar'))

ax.plot(X_grid, samples.numpy().T)

ax.set_xlabel(r'$x$')
ax.set_ylabel(r'$f(x)$')
ax.set_title(r'Draws of $f(x)$ from GP prior')

plt.show()
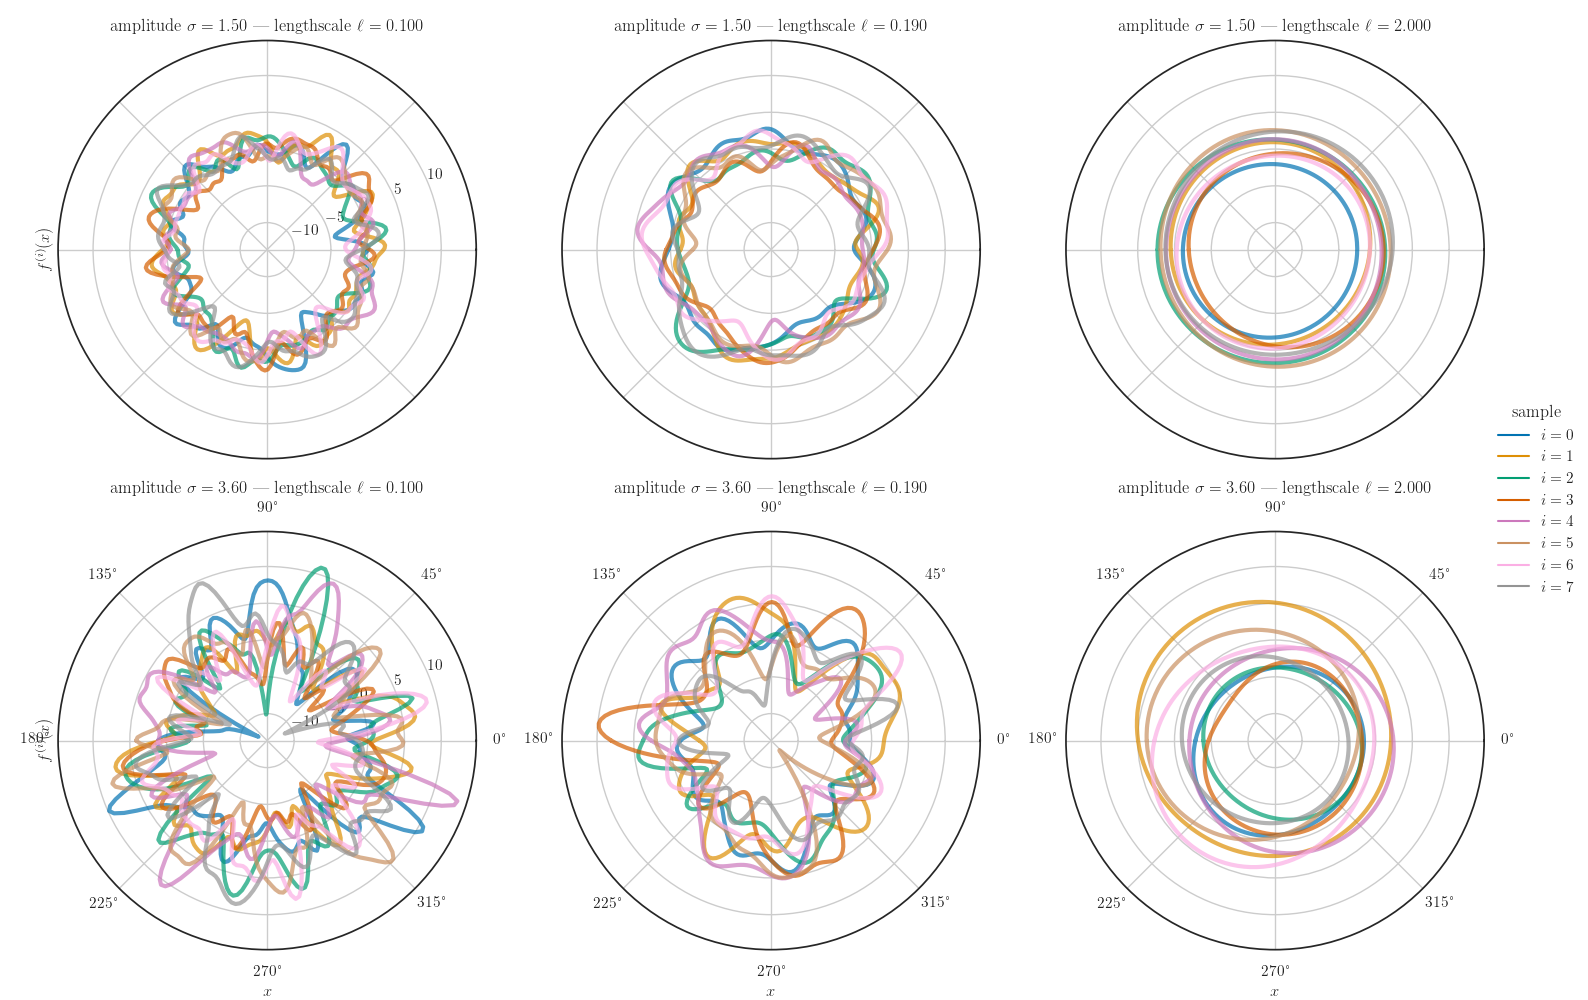
amplitude, length_scale_inv = np.ogrid[1.5:3.6:2j, 10.0:0.5:3j]
length_scale = 1.0 / length_scale_inv
kernel = kernel_cls(amplitude=amplitude, length_scale=length_scale, period=period)
gp = tfd.GaussianProcess(kernel=kernel, index_points=X_grid)
gp_samples = gp_sample_custom(gp, num_samples, seed=seed)
data = dataframe_from_gp_samples(gp_samples.numpy(), X_grid, amplitude,
                                 length_scale, num_samples)
data.rename(lambda s: s.replace('_', ' '), axis="columns", inplace=True)
g = sns.relplot(x="index point", y="function value", hue="sample",
                row="amplitude", col="length scale", height=5.0, aspect=1.0,
                kind="line", data=data, alpha=0.7, linewidth=3.0,
                facet_kws=dict(subplot_kws=dict(projection='polar'), despine=False))
g.set_titles(row_template=r"amplitude $\sigma={{{row_name:.2f}}}$",
             col_template=r"lengthscale $\ell={{{col_name:.3f}}}$")
g.set_axis_labels(r"$x$", r"$f^{(i)}(x)$")
Out:
<seaborn.axisgrid.FacetGrid object at 0x7f6a013f5fd0>
Total running time of the script: ( 0 minutes 9.140 seconds)