Note
Click here to download the full example code
Cryptocurrency Exchange Trades
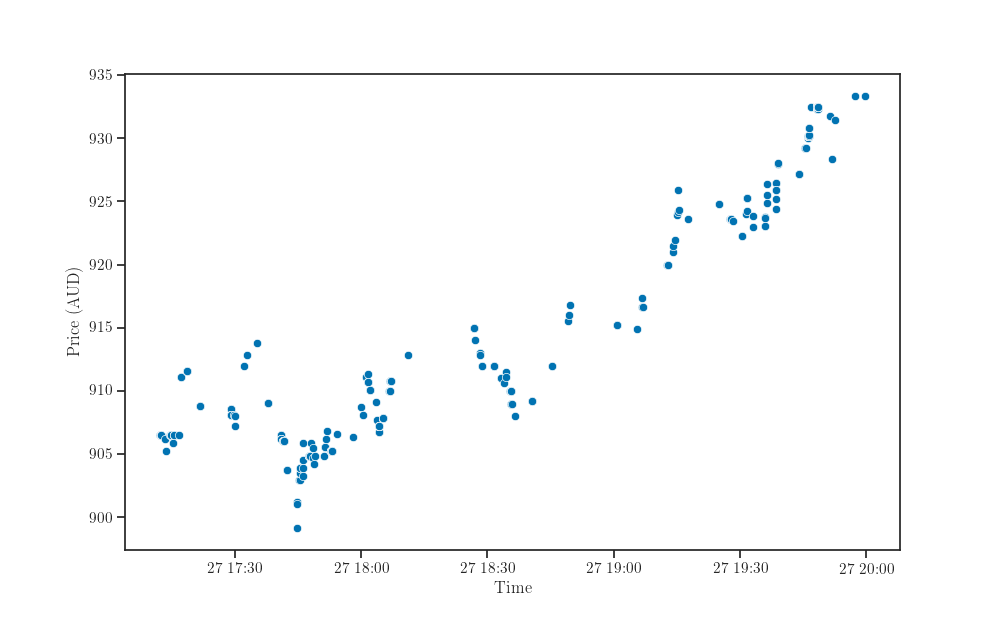
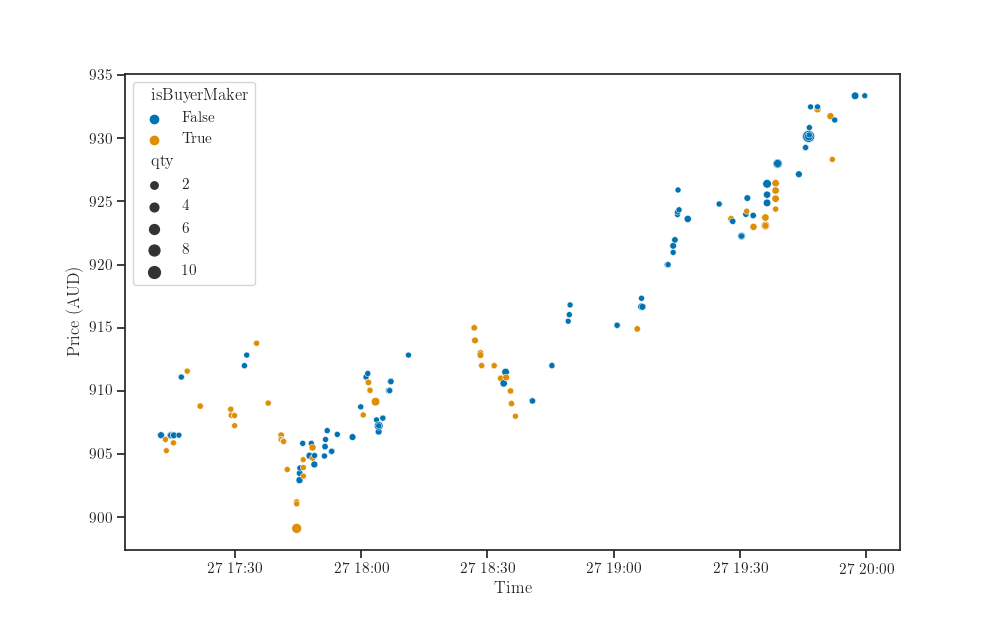
Recent trade histories on Binance, a popular cryptocurrency exchange, for a specified symbol (trading pair).
import requests
import pandas as pd

import matplotlib.pyplot as plt
import seaborn as sns
pair = ("ETH", "AUD")
symbol = "".join(pair)
frame = pd.read_json(f"https://api.binance.com/api/v3/trades?symbol={symbol}",
                     convert_dates=["time"])
frame.set_index("time", inplace=True)
frame
fig, ax = plt.subplots()

sns.scatterplot(x="time", y="price", data=frame, ax=ax)

ax.set_xlabel("Time")
ax.set_ylabel(f"Price ({pair[1]})")

plt.show()

fig, ax = plt.subplots()

sns.scatterplot(x="time", y="price", hue="isBuyerMaker", size="qty",
                data=frame, ax=ax)

ax.set_xlabel("Time")
ax.set_ylabel(f"Price ({pair[1]})")

plt.show()

Total running time of the script: ( 0 minutes 2.399 seconds)