Note
Click here to download the full example code
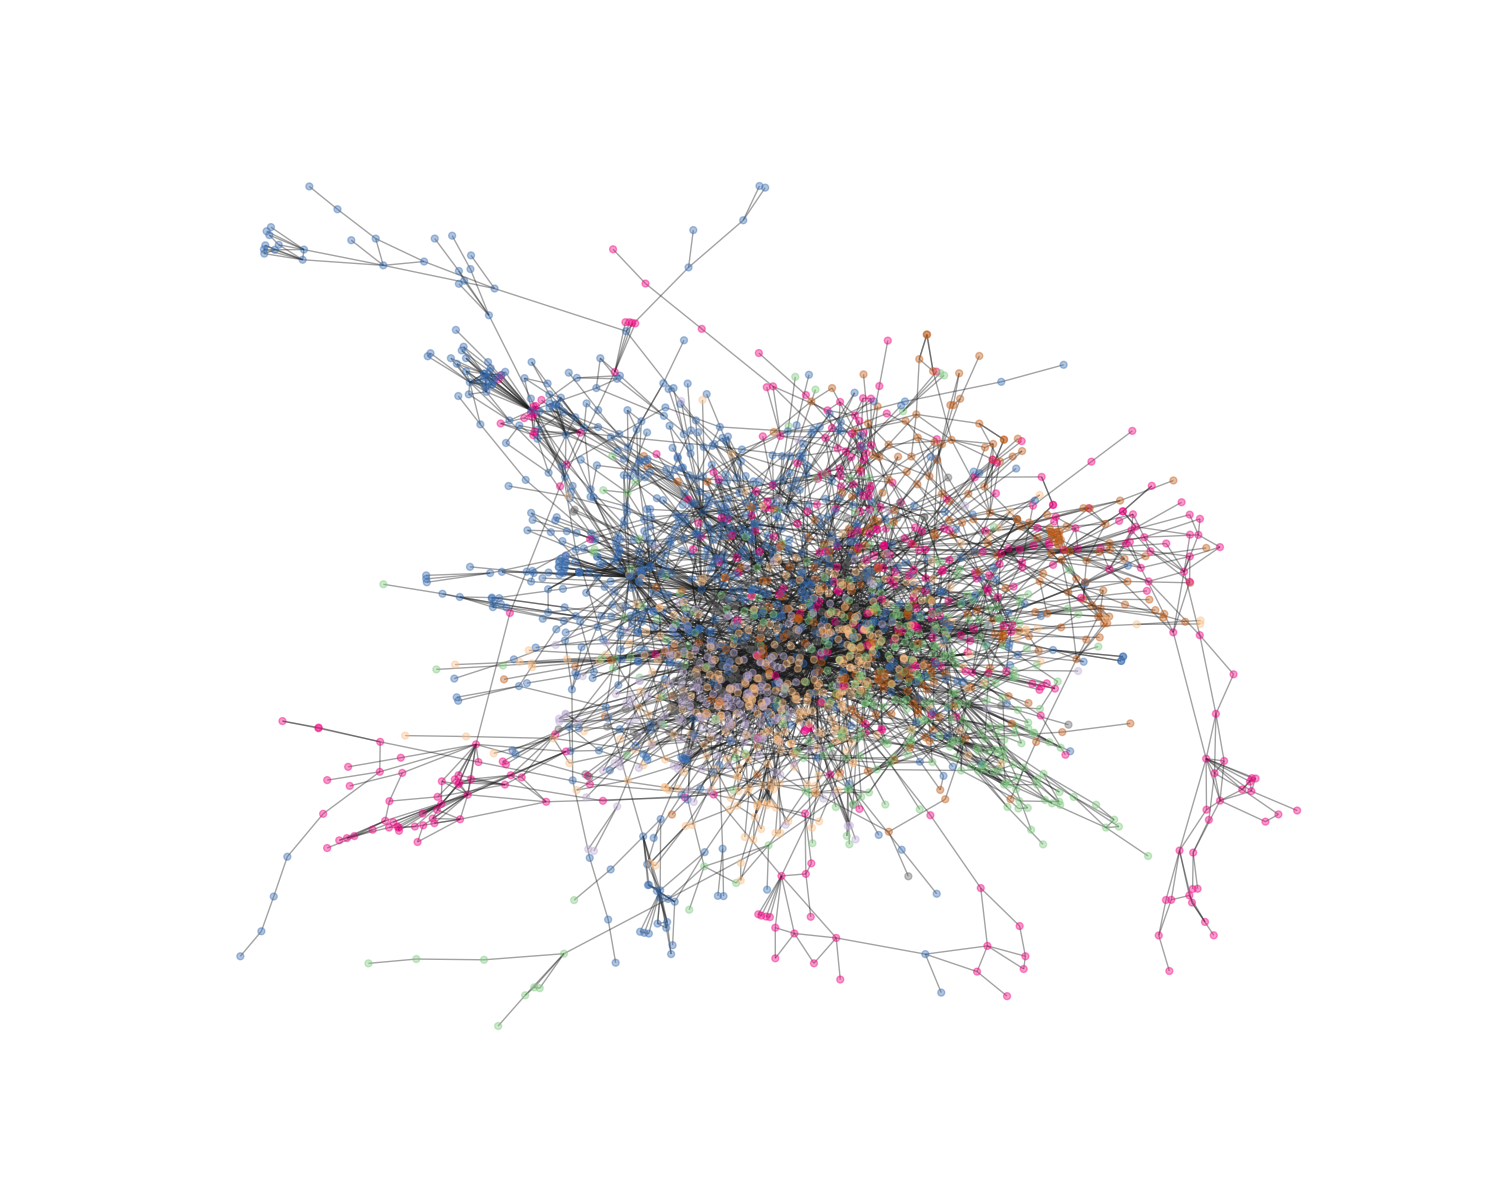
Cora Citation Network
Hello world
import networkx as nx
import matplotlib.pyplot as plt

from etudes.datasets.networks import load_dataset
X, y, A = load_dataset("cora", data_home="../../datasets")
G = nx.from_scipy_sparse_matrix(A)
C = max(nx.connected_components(G), key=len)
fig, ax = plt.subplots(figsize=(15, 12))

nx.draw(G.subgraph(C), node_color=y[list(C)].argmax(axis=1), node_size=25,
        alpha=0.4, cmap="Accent", ax=ax)

plt.show()

Total running time of the script: ( 0 minutes 21.812 seconds)