Note
Click here to download the full example code
Honey Bee Dance Data
Hello world
import numpy as np
import seaborn as sns

from etudes.datasets import load_bee_dance_dataframe

golden_ratio = 0.5 * (1 + np.sqrt(5))
data = load_bee_dance_dataframe(base_dir="../../datasets")
data = data.assign(label=data.label.map(dict(waggle="waggle",
                                             turn_right="turn right",
                                             turn_left="turn left")))
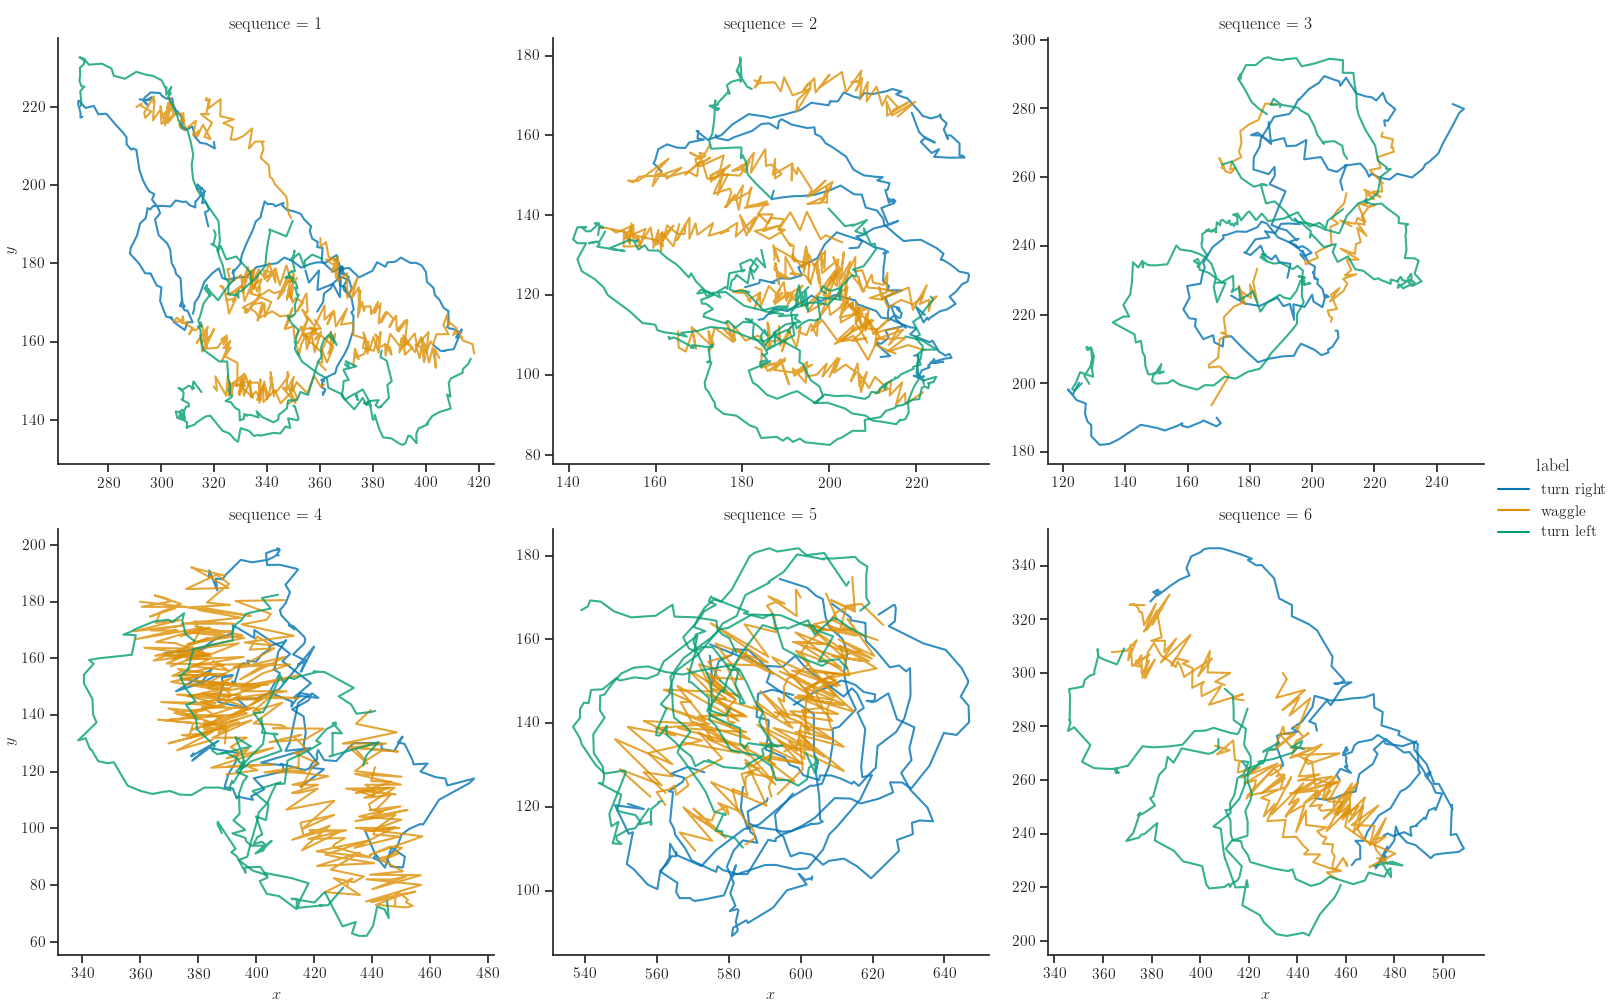
g = sns.relplot(x='x', y='y', units='phase', estimator=None, hue="label",
                col="sequence", col_wrap=3, kind="line", sort=False,
                data=data, height=5, aspect=1, alpha=0.8,
                facet_kws=dict(sharex=False, sharey=False))
g.set_axis_labels(r"$x$", r"$y$")
Out:
<seaborn.axisgrid.FacetGrid object at 0x7f6b8808d9b0>
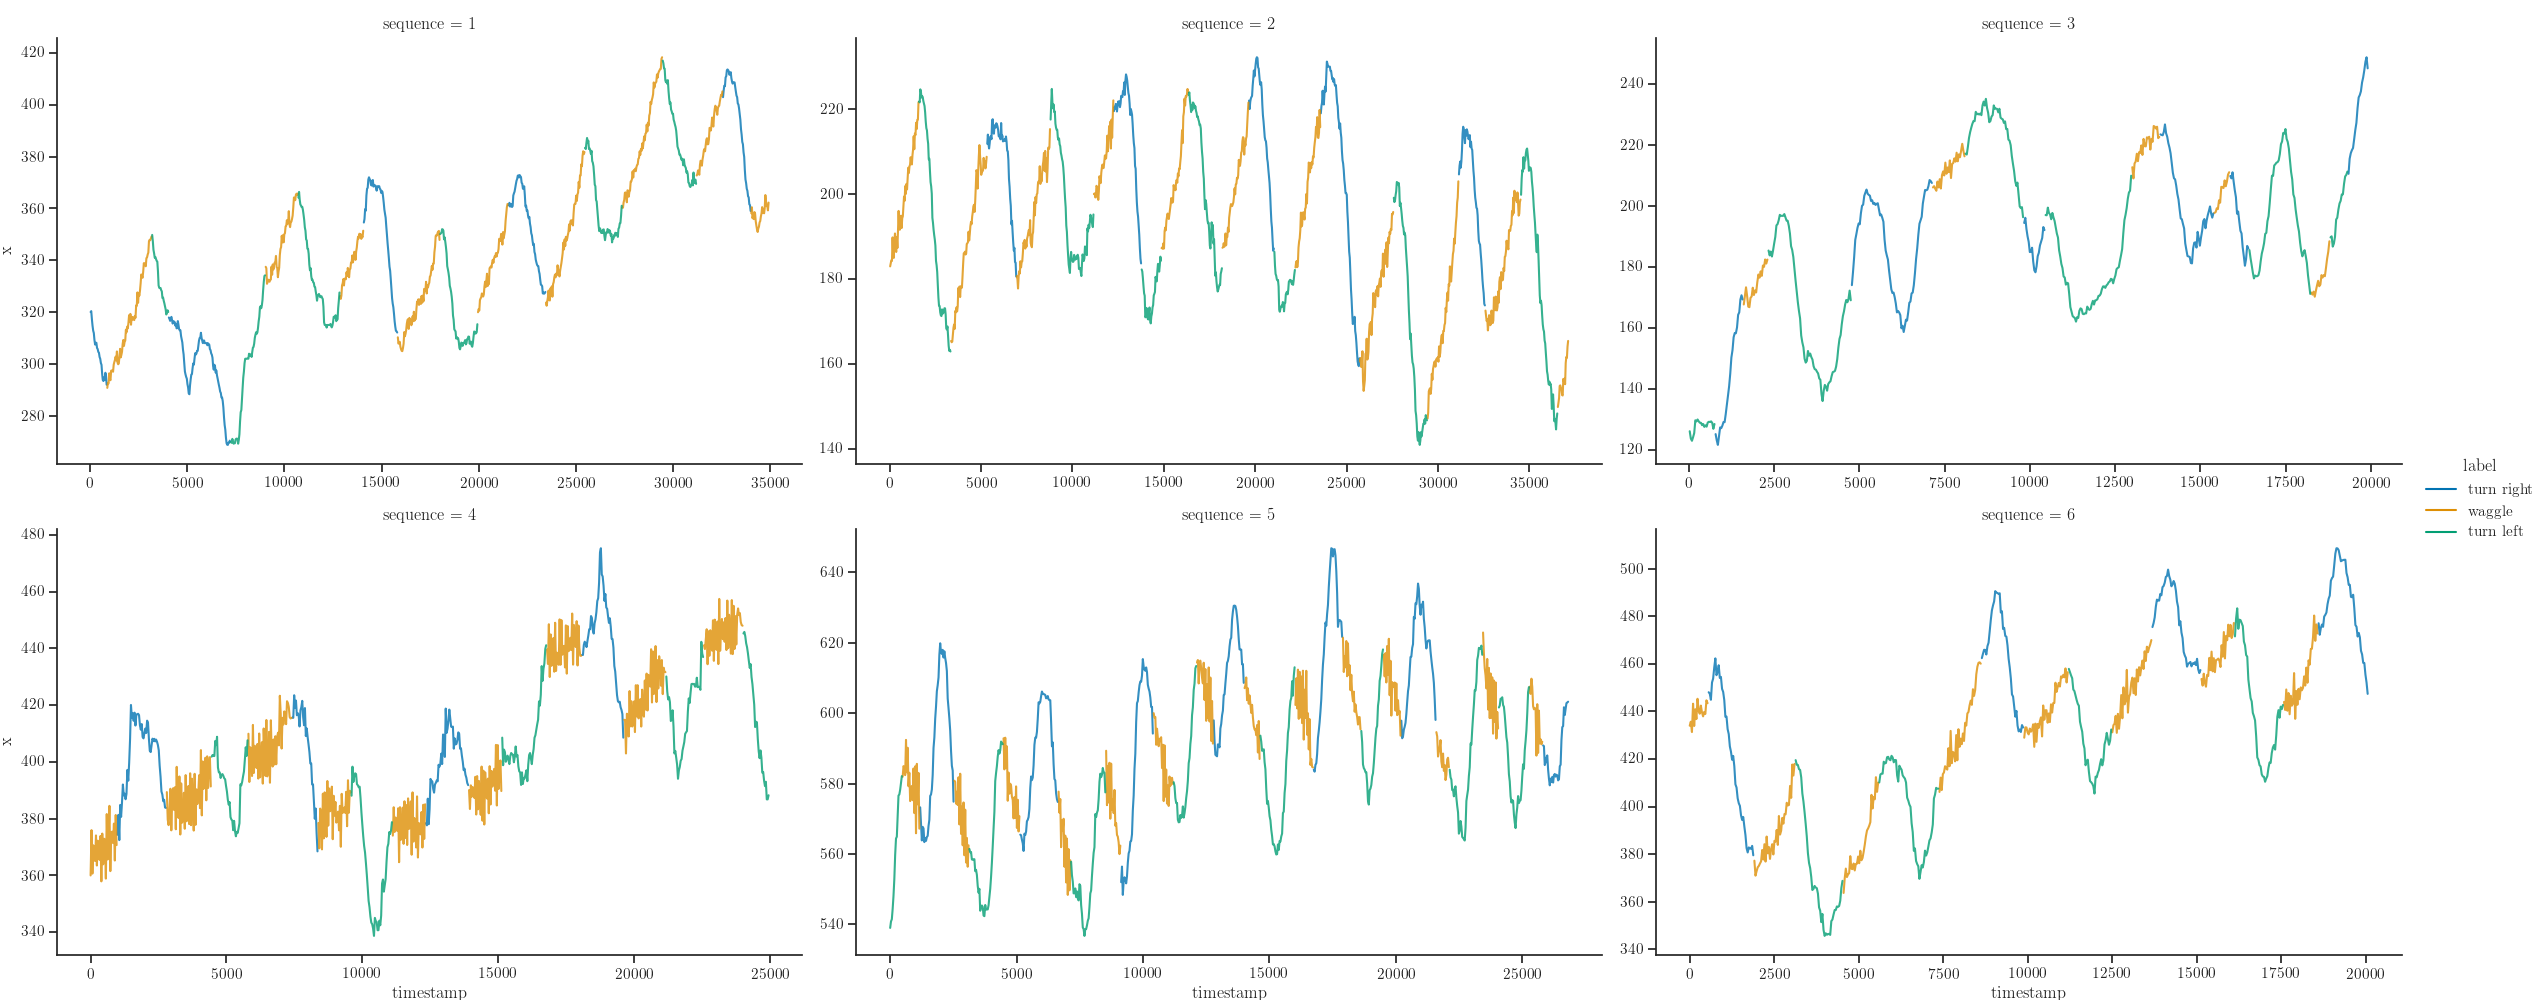
sns.relplot(x="timestamp", y="x", units='phase', estimator=None, hue="label",
            col="sequence", col_wrap=3, kind="line",
            data=data, height=5, aspect=golden_ratio,
            alpha=0.8, facet_kws=dict(sharex=False, sharey=False))
Out:
<seaborn.axisgrid.FacetGrid object at 0x7f6b6c0bdc18>
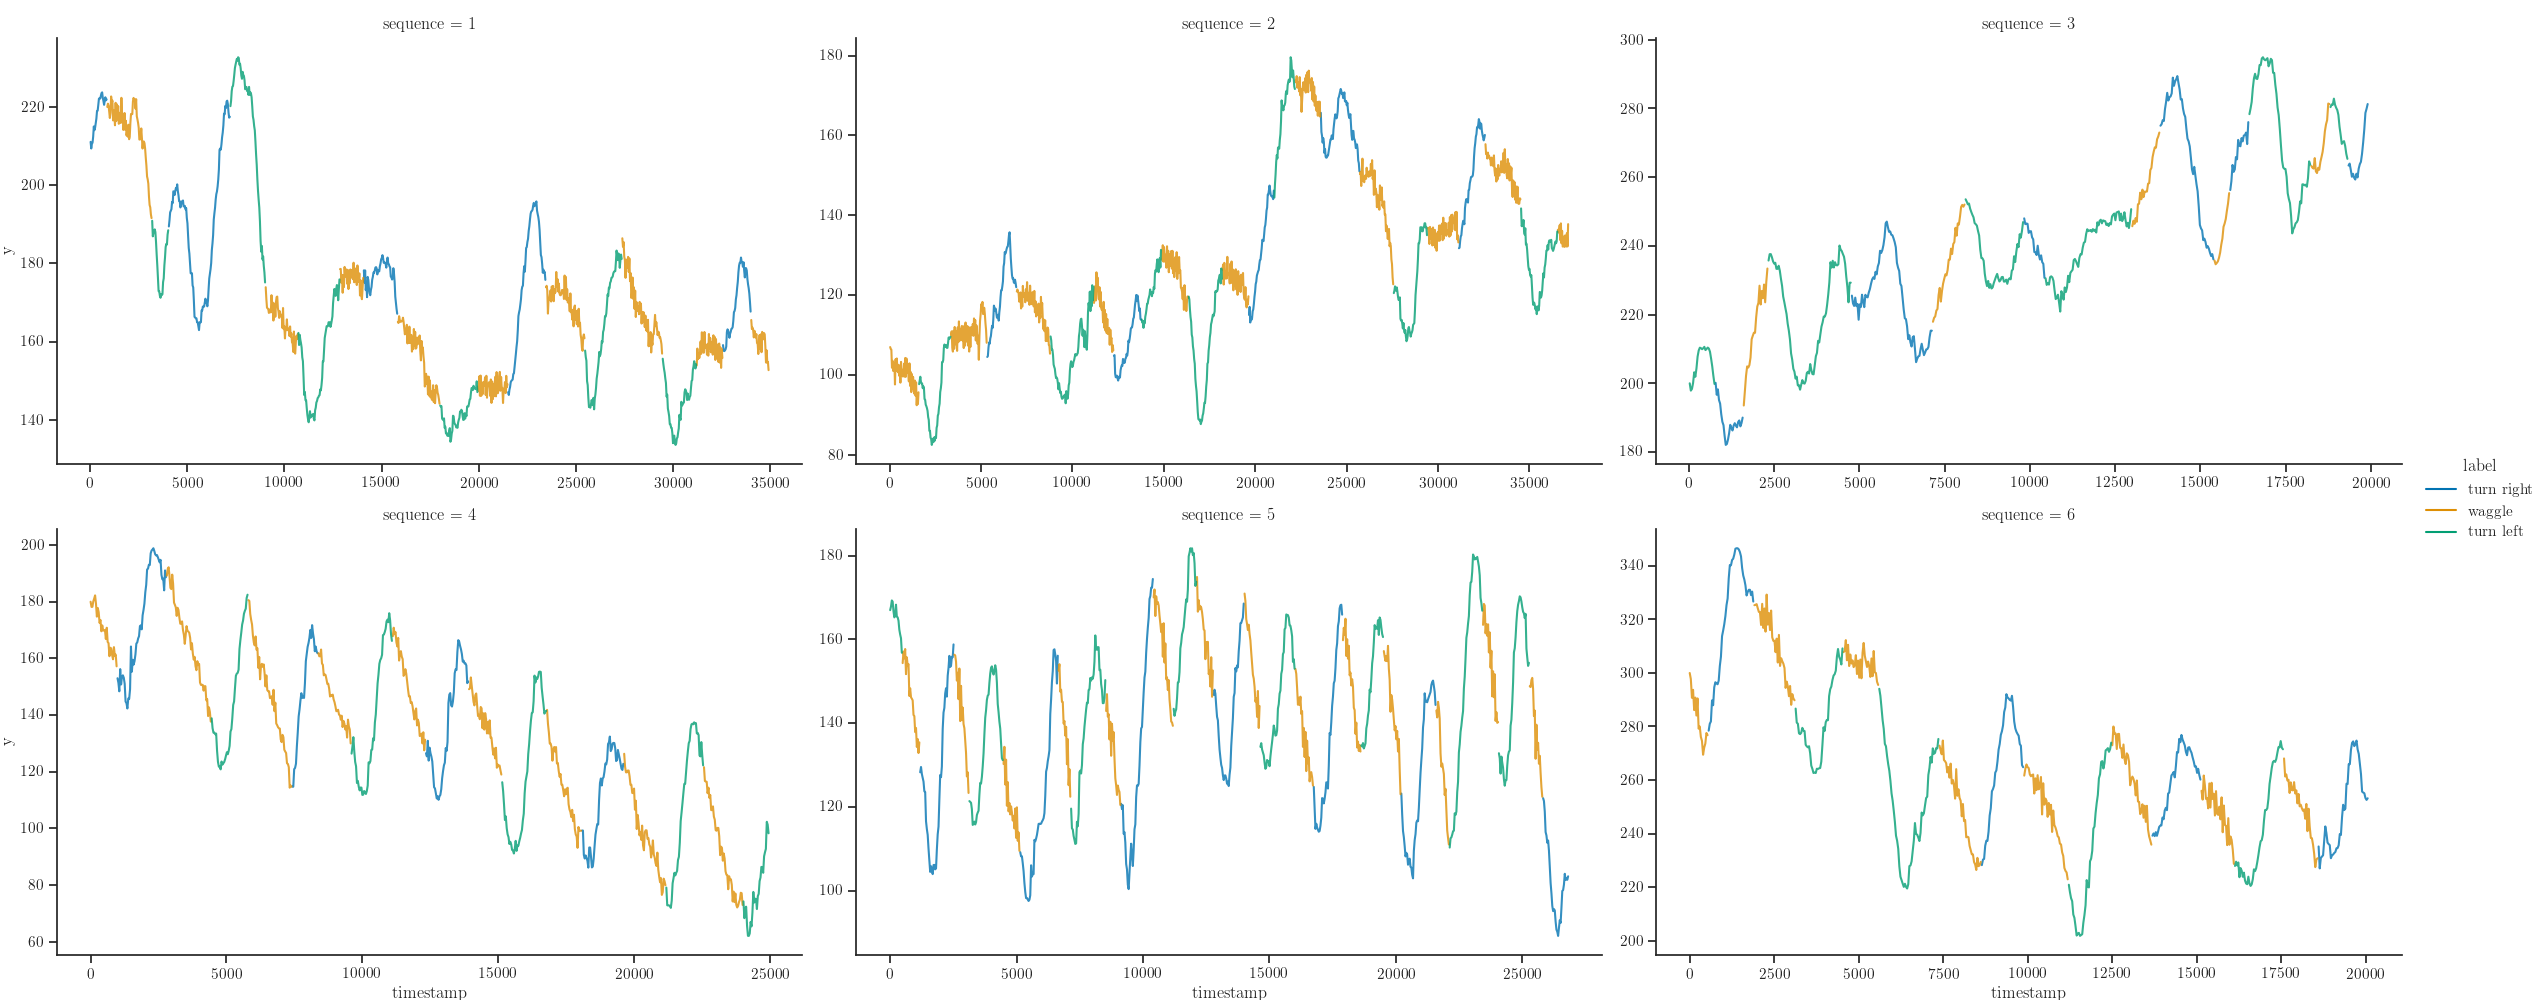
sns.relplot(x="timestamp", y="y", units='phase', estimator=None, hue="label",
            col="sequence", col_wrap=3, kind="line",
            data=data, height=5, aspect=golden_ratio,
            alpha=0.8, facet_kws=dict(sharex=False, sharey=False))
Out:
<seaborn.axisgrid.FacetGrid object at 0x7f6a01efde48>
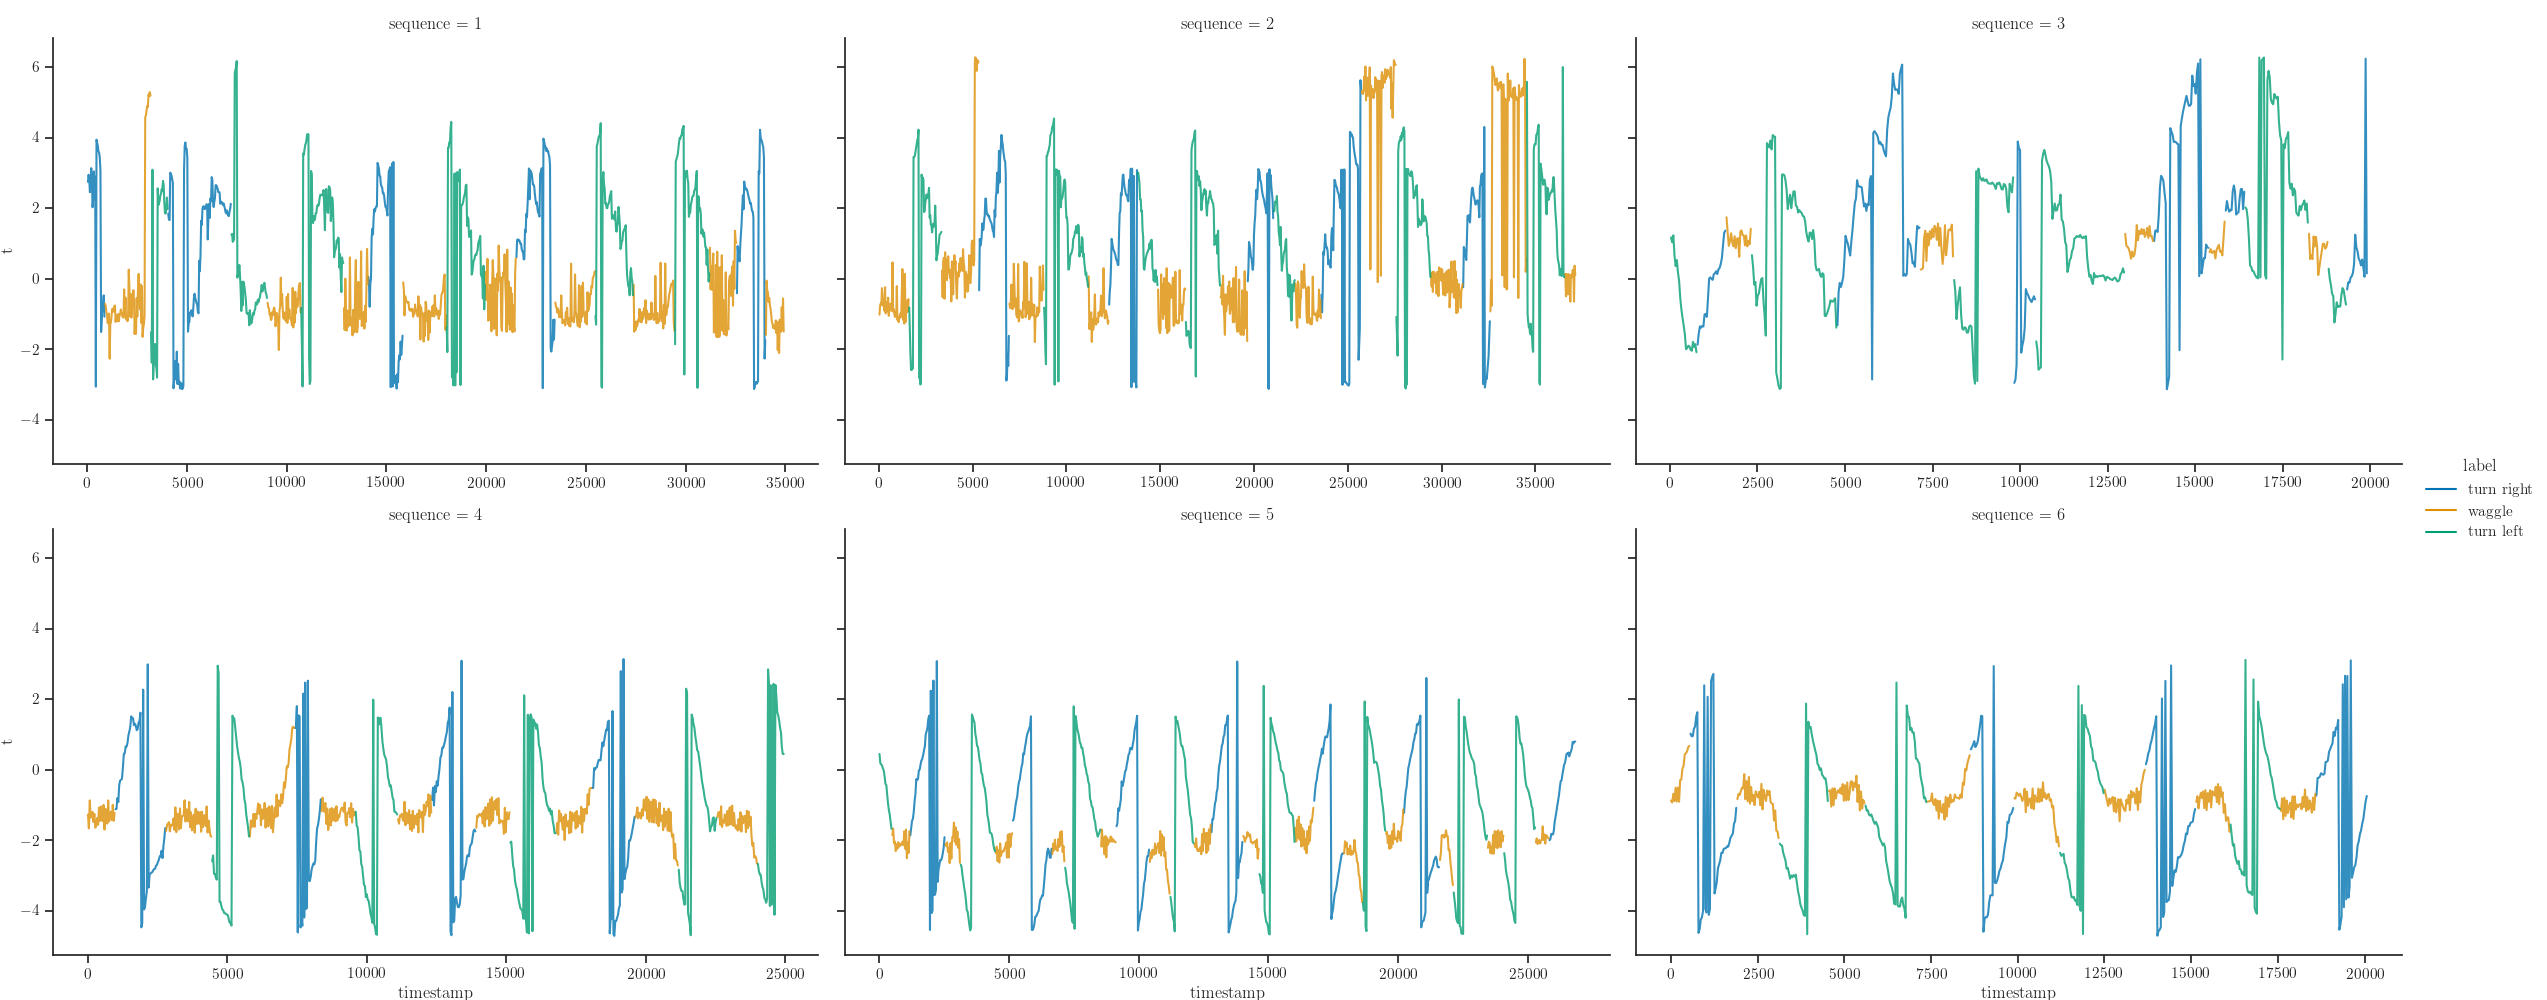
sns.relplot(x="timestamp", y="t", units='phase', estimator=None, hue="label",
            col="sequence", col_wrap=3, kind="line",
            data=data, height=5, aspect=golden_ratio,
            alpha=0.8, facet_kws=dict(sharex=False))
Out:
<seaborn.axisgrid.FacetGrid object at 0x7f6a01b8e940>
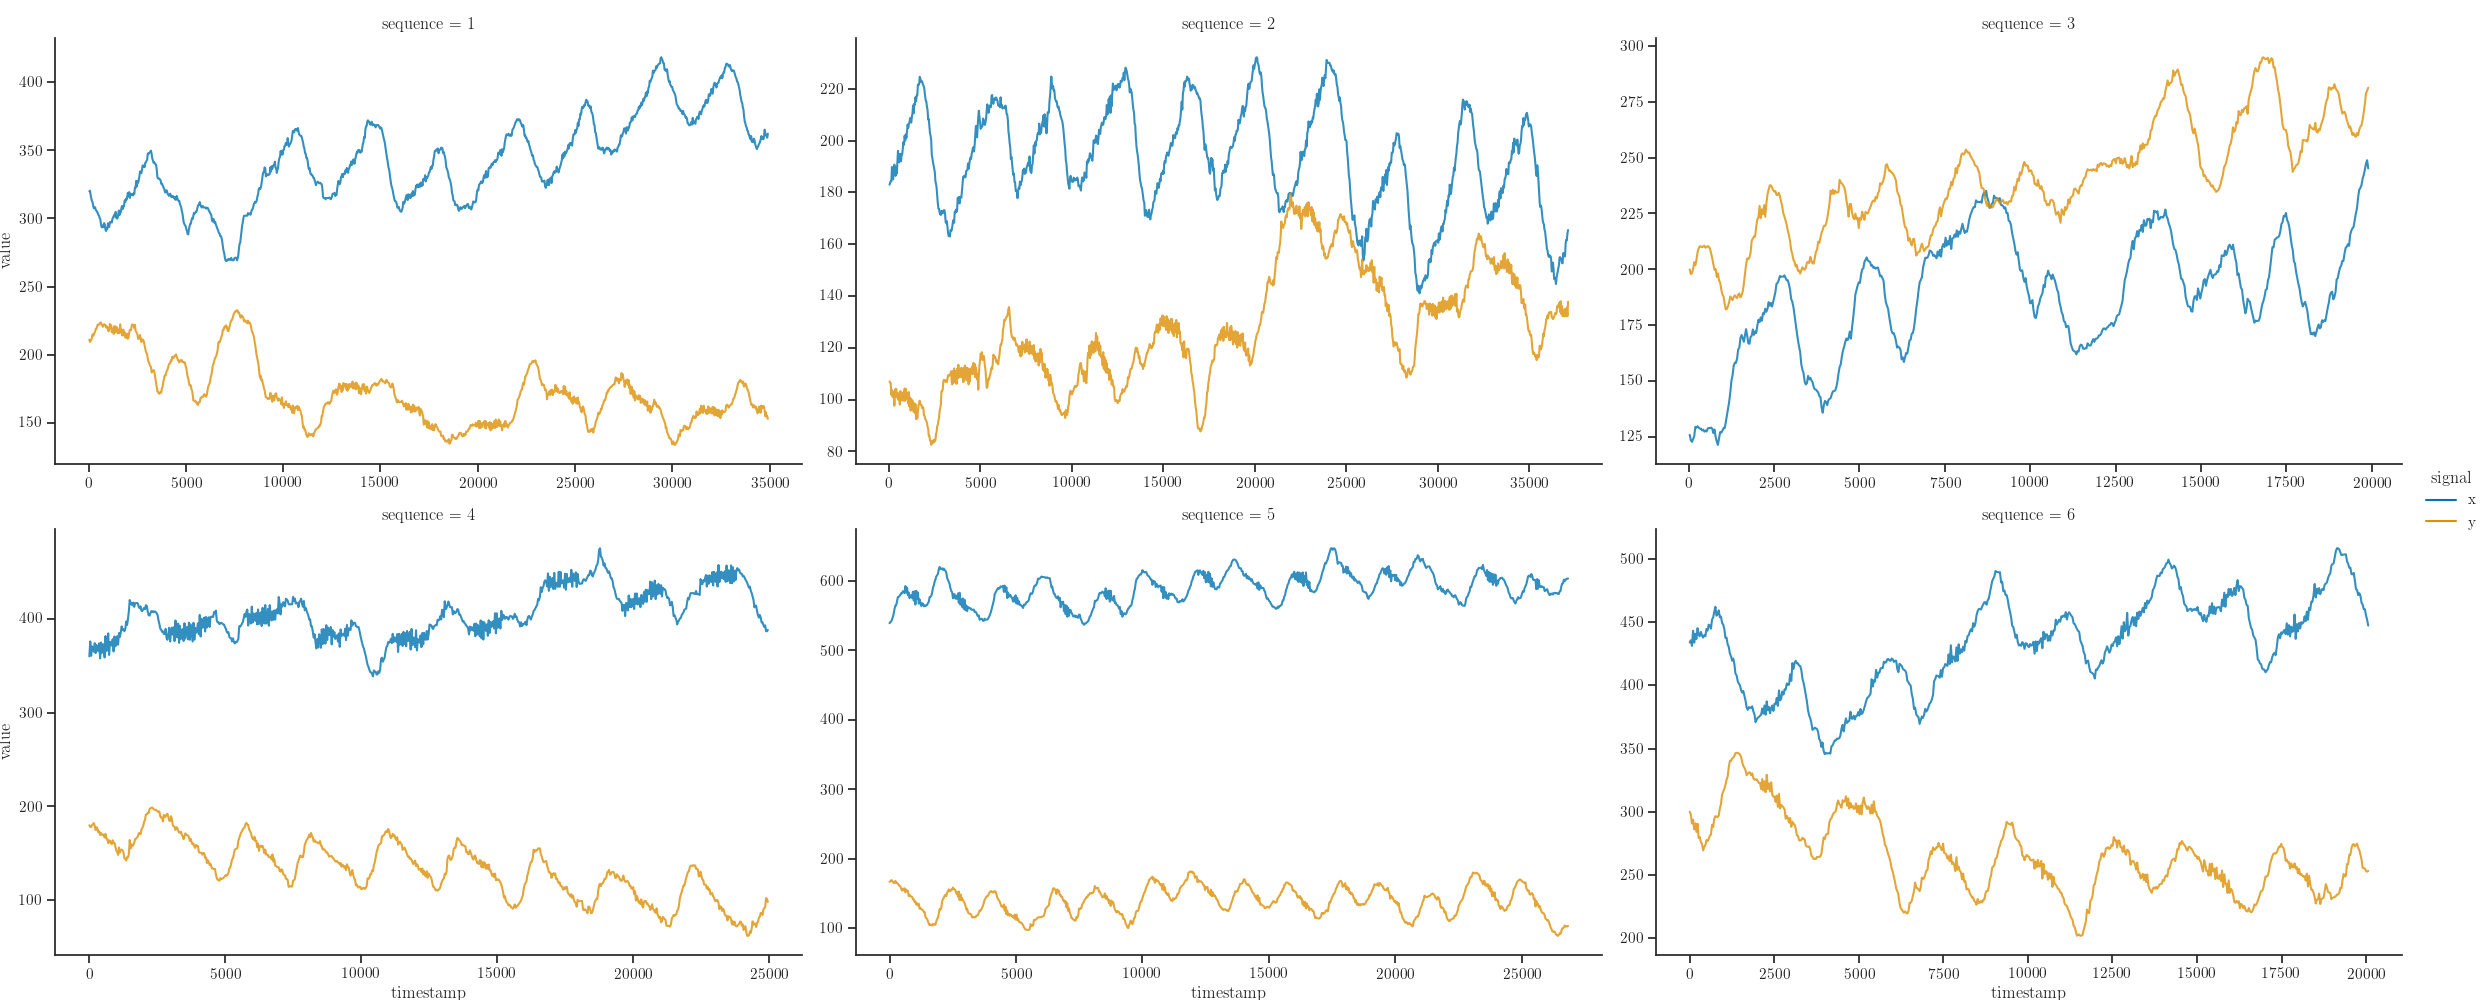
long_data = data.melt(id_vars=["sequence", "timestamp", "label"],
                      value_vars=['x', 'y'], var_name="signal")

sns.relplot(x="timestamp", y="value", hue="signal",
            col="sequence", col_wrap=3, kind="line",
            data=long_data, height=5, aspect=golden_ratio,
            alpha=0.8, facet_kws=dict(sharex=False, sharey=False))
Out:
<seaborn.axisgrid.FacetGrid object at 0x7f6a01ae1e48>
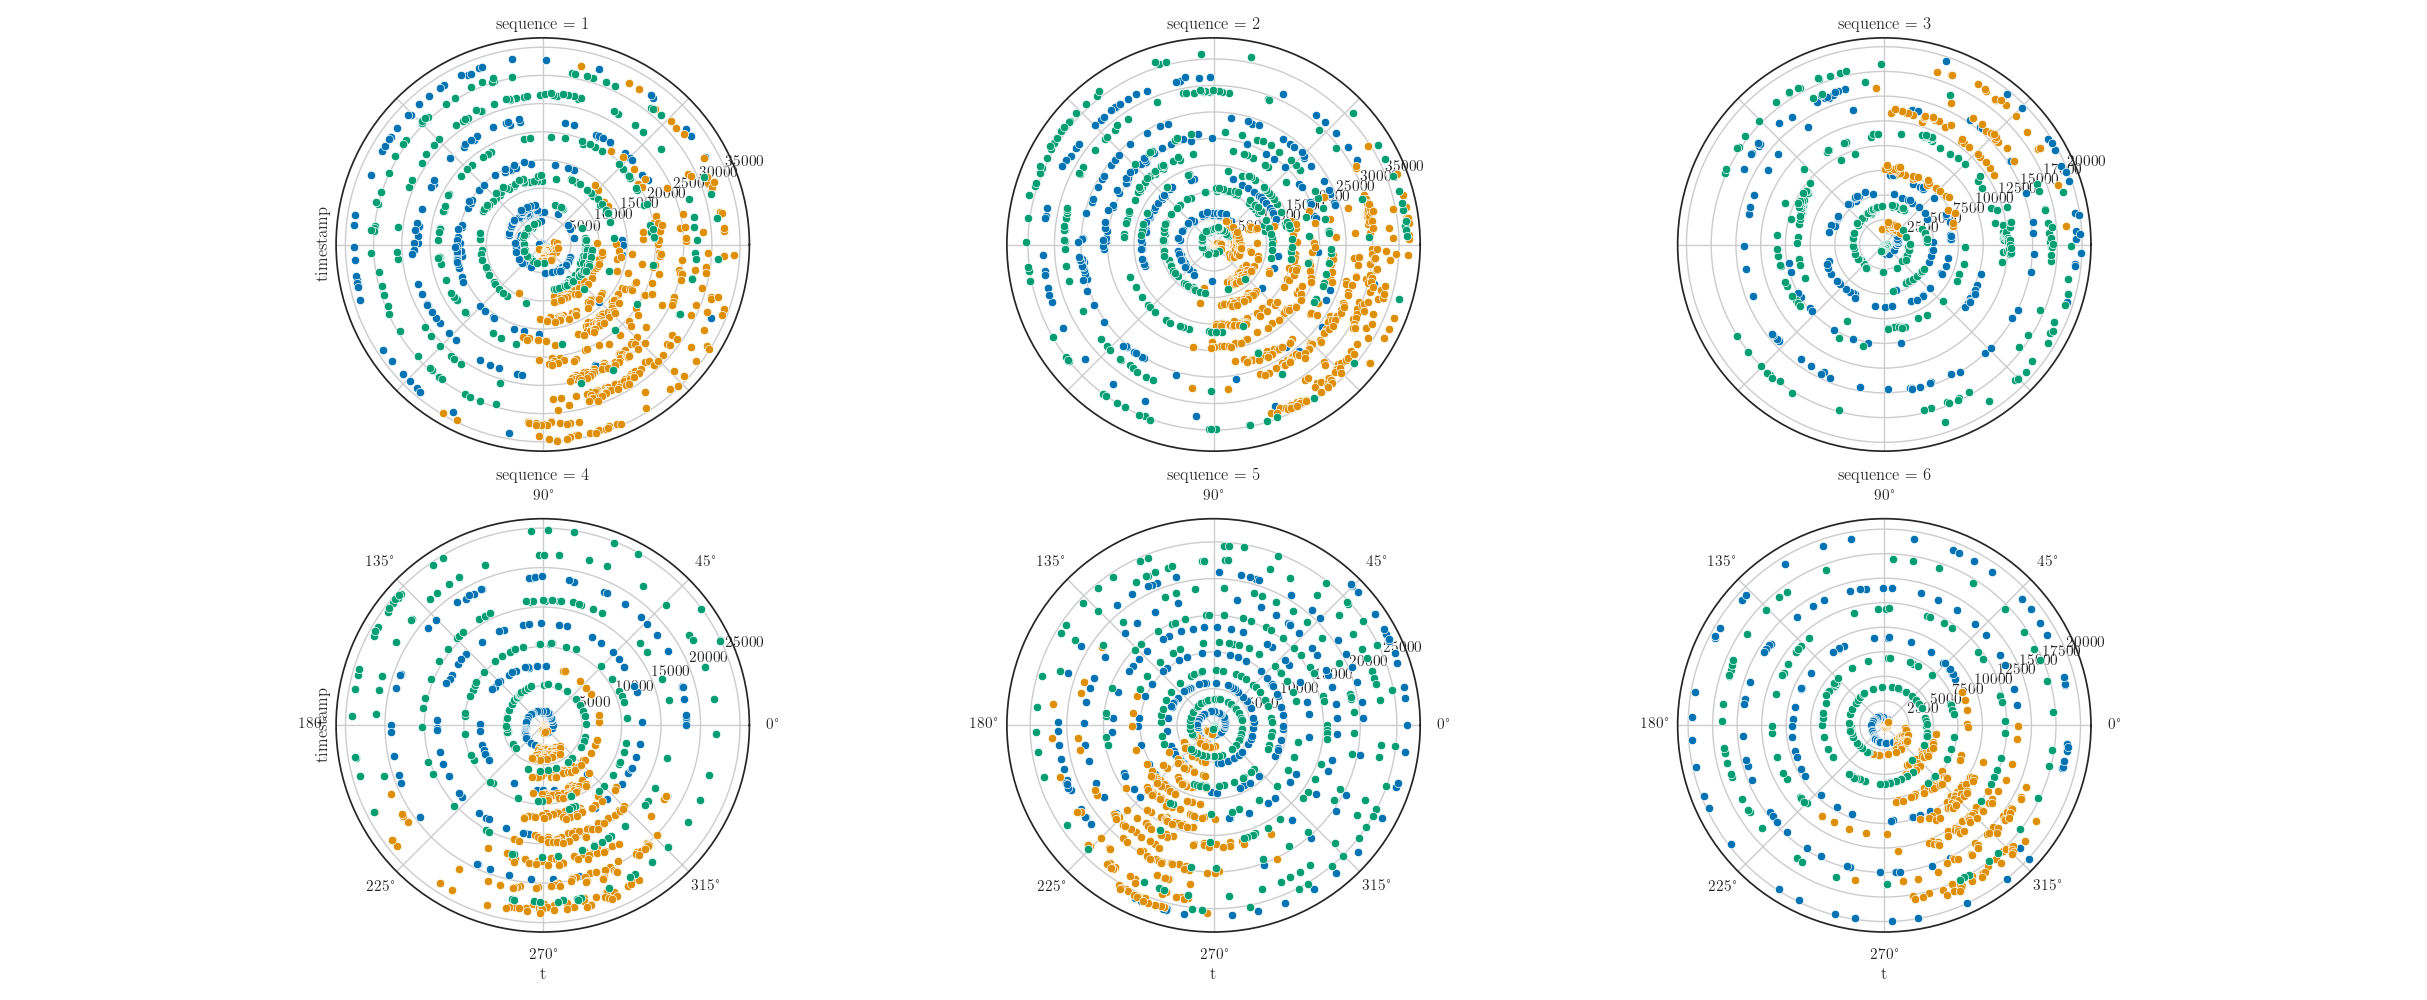
g = sns.FacetGrid(data, hue="label", col="sequence", col_wrap=3,
                  height=5, aspect=golden_ratio,
                  subplot_kws=dict(projection='polar'),
                  sharey=False, despine=False)
g.map(sns.scatterplot, "t", "timestamp")
Out:
<seaborn.axisgrid.FacetGrid object at 0x7f6b6c0c20b8>
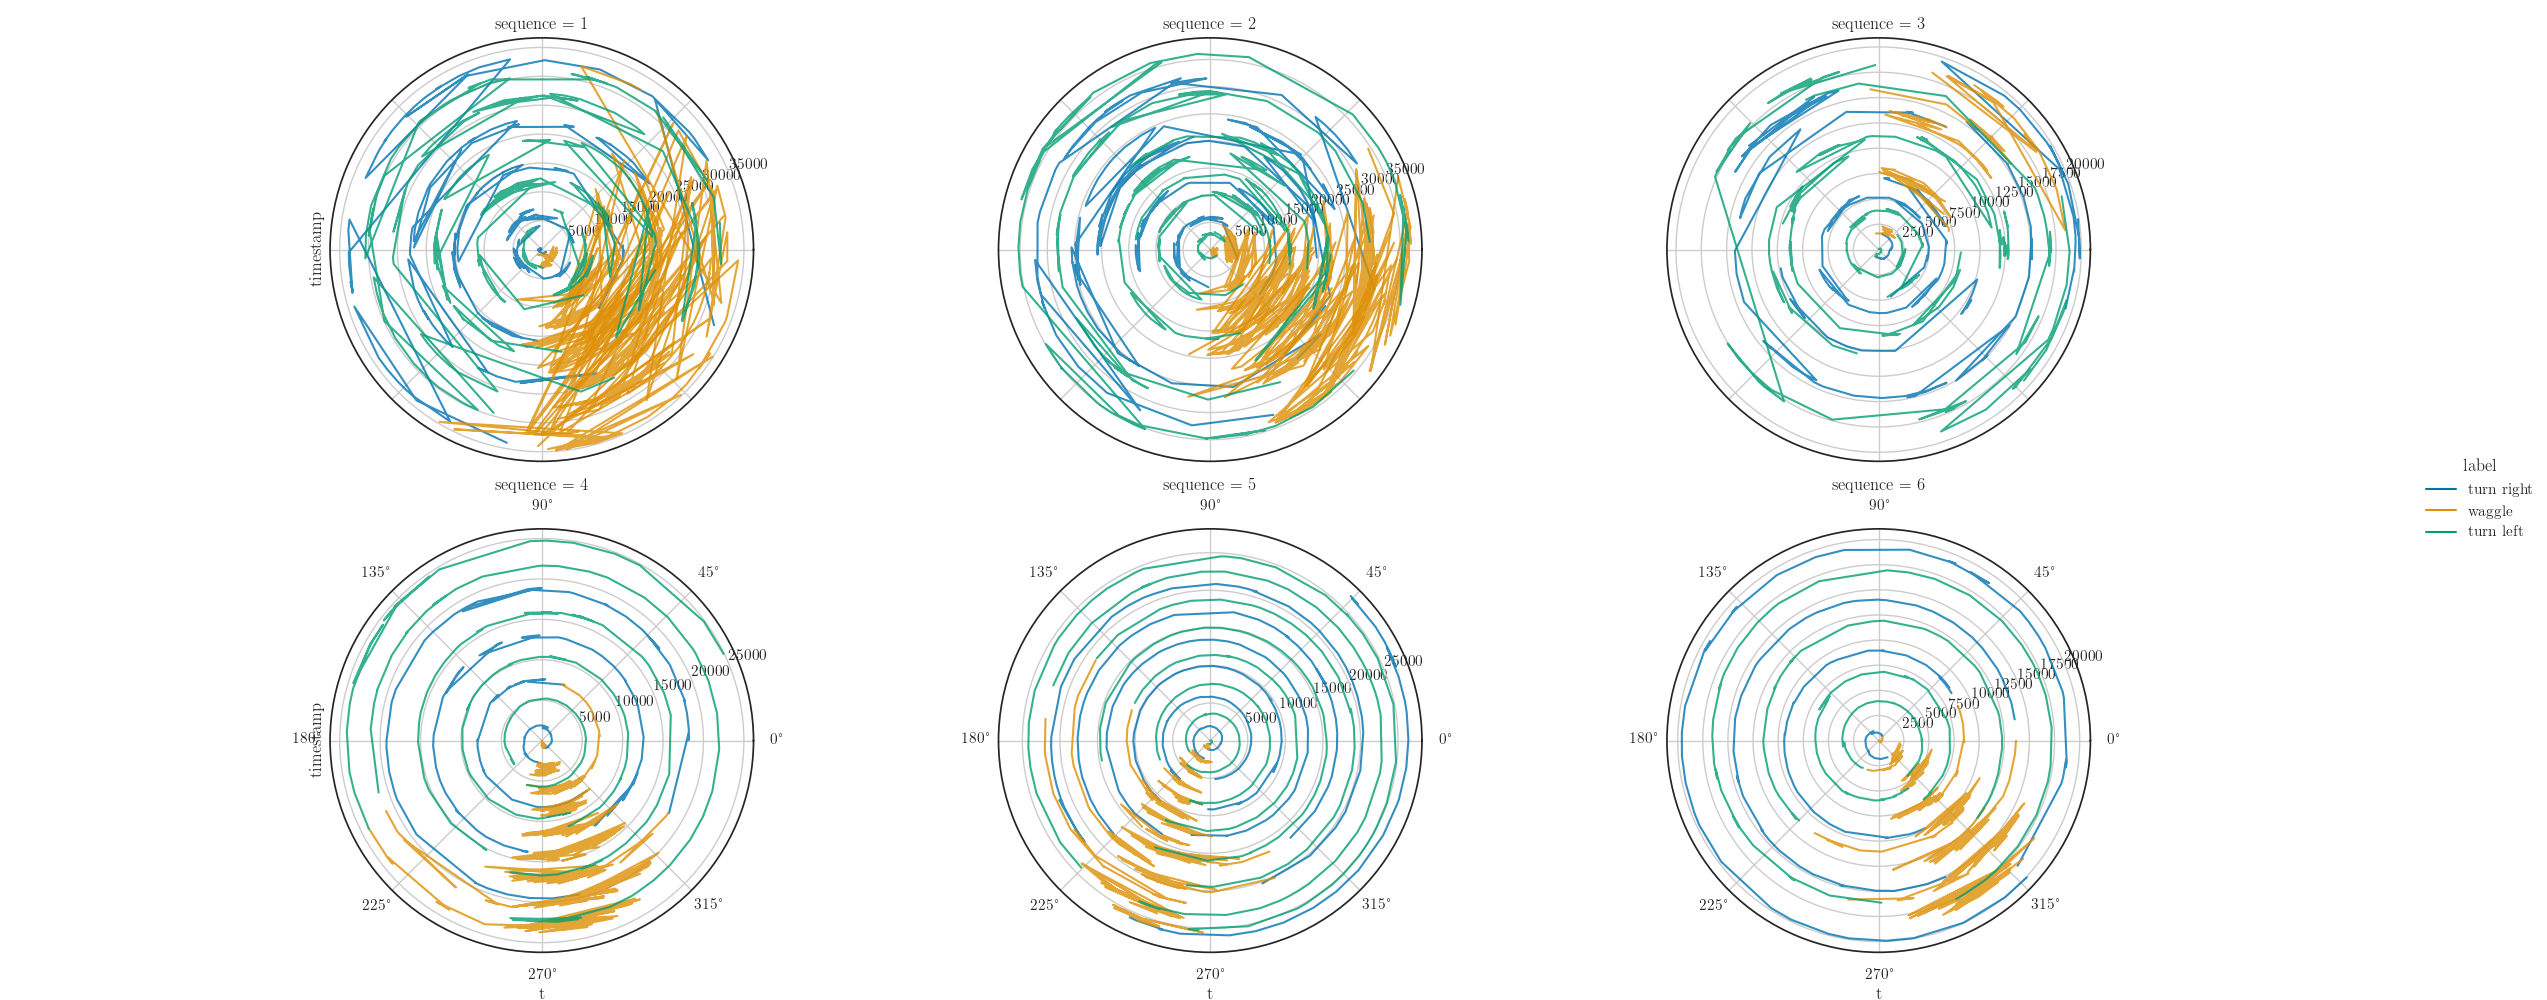
g = sns.relplot(x="t", y="timestamp", units='phase', estimator=None, hue="label",
                col="sequence", col_wrap=3, kind="line", sort=False,
                data=data, height=5, aspect=golden_ratio,
                alpha=0.8, facet_kws=dict(subplot_kws=dict(projection='polar'),
                                          sharey=False, despine=False))
Total running time of the script: ( 0 minutes 21.934 seconds)