Note
Click here to download the full example code
Expected Improvement Acquisition Function
Hello world
import numpy as np
import tensorflow as tf
import tensorflow_probability as tfp

import matplotlib.pyplot as plt
import pandas as pd
import seaborn as sns

from etudes.datasets import make_regression_dataset
from etudes.plotting import fill_between_stddev
# shortcuts
tfd = tfp.distributions
kernels = tfp.math.psd_kernels
kernel_cls = kernels.ExponentiatedQuadratic

# constants
num_samples = 5
num_index_points = 128
num_features = 1
noise_variance = 0.5
# x_min, x_max = 0.0, 1.0
x_min, x_max = -1.0, 2.0
quantile_grid = np.arange(0., 0.8, 0.15)

X_grid = np.linspace(x_min-5., x_max+5., num_index_points).reshape(-1, num_features)

num_epochs = 200
learning_rate = 0.05
beta_1 = 0.5
beta_2 = 0.99
jitter = 1e-6

seed = 8989
random_state = np.random.RandomState(seed)
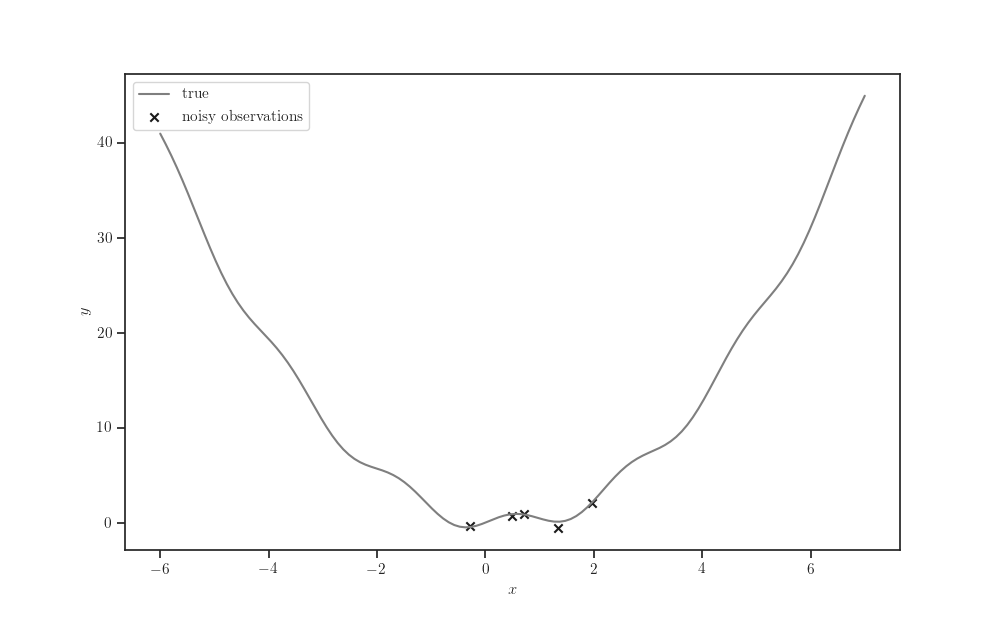
def forrester(x):
    """
    Forrester's.
    """
    # return (6.0*x-2.0)**2 * np.sin(12.0 * x - 4.0)
    return np.sin(3.0*x) + x**2 - 0.7*x
def mixture(p, q, pi=0.):
    return pi*p + (1 - pi)*q
load_observations = make_regression_dataset(forrester)
X, y = load_observations(num_samples=num_samples,
                         num_features=num_features,
                         noise_variance=noise_variance,
                         x_min=x_min, x_max=x_max,
                         random_state=random_state)
fig, ax = plt.subplots()

ax.plot(X_grid, forrester(X_grid), label="true", color="tab:gray")
ax.scatter(X, y, marker='x', color='k', label="noisy observations")

ax.set_xlabel(r'$x$')
ax.set_ylabel(r"$y$")

ax.legend()

plt.show()

amplitude = tfp.util.TransformedVariable(
    1.0, bijector=tfp.bijectors.Softplus(), dtype="float64", name='amplitude')
length_scale = tfp.util.TransformedVariable(
    0.5, bijector=tfp.bijectors.Softplus(), dtype="float64", name='length_scale')
observation_noise_variance = tfp.util.TransformedVariable(
    1e-1, bijector=tfp.bijectors.Softplus(), dtype="float64",
    name='observation_noise_variance')
kernel = kernel_cls(amplitude=amplitude, length_scale=length_scale)
gp = tfd.GaussianProcess(
    kernel=kernel, index_points=X,
    observation_noise_variance=observation_noise_variance)
optimizer = tf.keras.optimizers.Adam(learning_rate=learning_rate,
                                     beta_1=beta_1, beta_2=beta_2)
for epoch in range(num_epochs):

    with tf.GradientTape() as tape:
        nll = - gp.log_prob(y)

    gradients = tape.gradient(nll, gp.trainable_variables)
    optimizer.apply_gradients(zip(gradients, gp.trainable_variables))
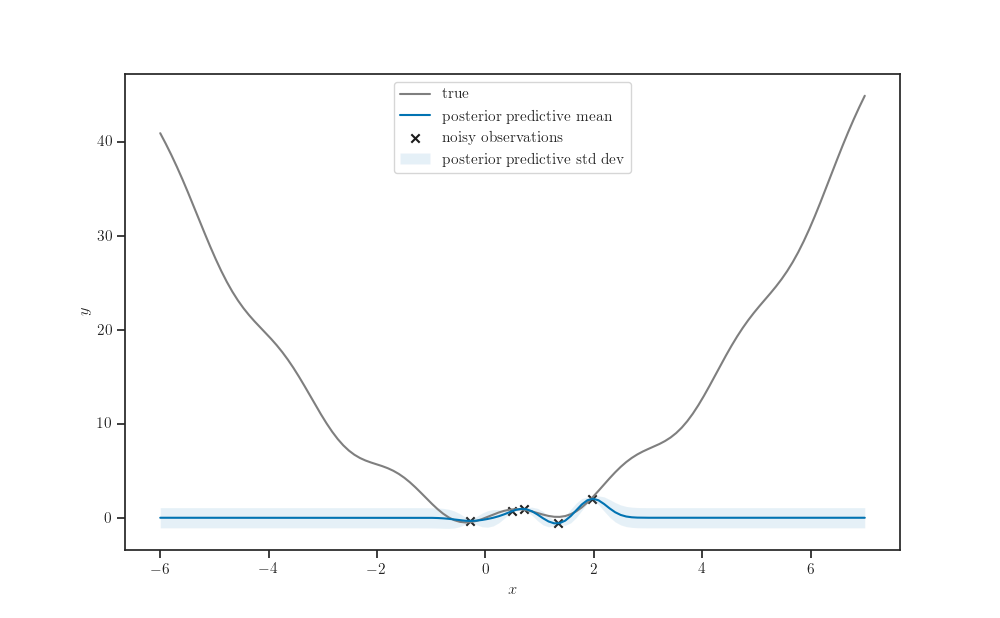
gprm = tfd.GaussianProcessRegressionModel(
    kernel=kernel, index_points=X_grid,
    observation_index_points=X, observations=y,
    observation_noise_variance=observation_noise_variance, jitter=jitter)
fig, ax = plt.subplots()

ax.plot(X_grid, forrester(X_grid), label="true", color="tab:gray")
ax.scatter(X, y, marker='x', color='k', label="noisy observations")

ax.plot(X_grid, gprm.mean(), label="posterior predictive mean")

fill_between_stddev(X_grid.squeeze(),
                    gprm.mean().numpy().squeeze(),
                    gprm.stddev().numpy().squeeze(), alpha=0.1,
                    label="posterior predictive std dev", ax=ax)

ax.legend()

ax.set_xlabel(r'$x$')
ax.set_ylabel(r"$y$")

plt.show()

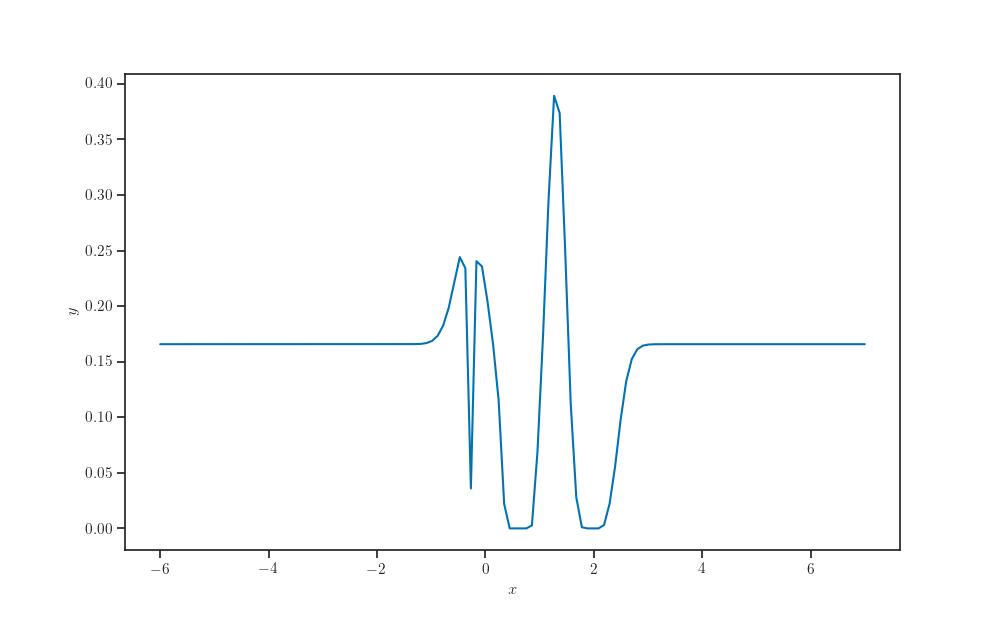
def expected_improvement(tau, gprm, index_points=None):

    p = tfd.Normal(loc=gprm.mean(index_points=index_points),
                   scale=gprm.stddev(index_points=index_points))

    alpha = tau - gprm.mean(index_points=index_points)
    alpha *= p.cdf(tau)
    alpha += gprm.stddev(index_points=index_points) * p.prob(tau)

    return alpha
tau = y.min()
ei = expected_improvement(tau, gprm, index_points=X_grid)
fig, ax = plt.subplots()

ax.plot(X_grid, ei)

ax.set_xlabel(r'$x$')
ax.set_ylabel(r"$y$")

plt.show()

Create DataFrame.
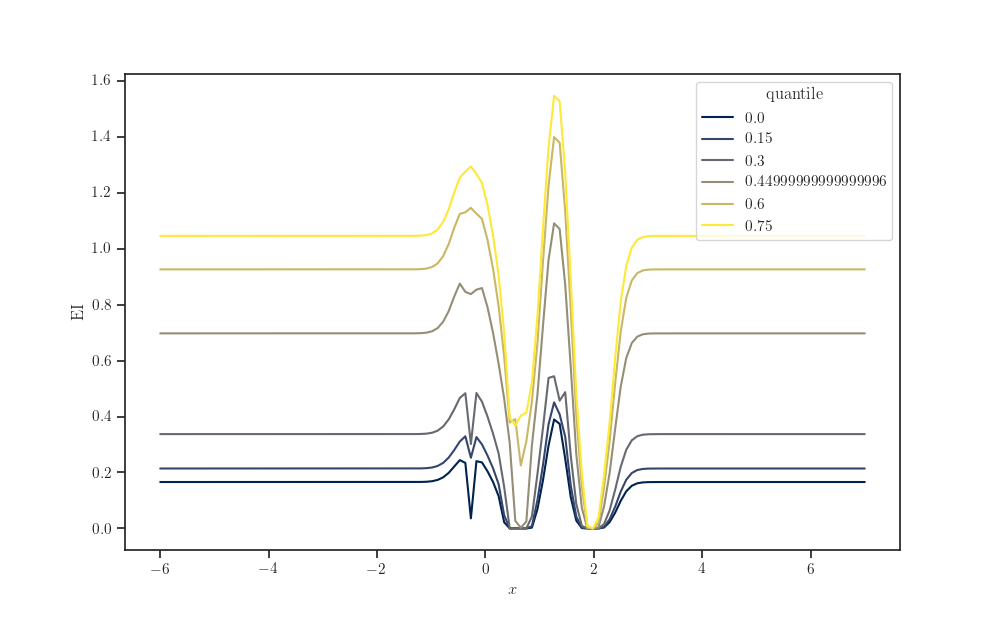
tau_grid = np.quantile(y, q=quantile_grid).reshape(-1, 1)
ei_grid = expected_improvement(tau_grid, gprm, index_points=X_grid)

frame = pd.DataFrame(data=ei_grid.numpy(), index=quantile_grid,
                     columns=X_grid.squeeze(axis=-1))
frame.index.name = "quantile"
frame.columns.name = r"$x$"
Turn into “long-form” or “tidy” data format.
s = frame.stack()
s.name = "EI"
data = s.reset_index()
fig, ax = plt.subplots()

sns.lineplot(x=r"$x$", y="EI", hue="quantile", palette="cividis",
             data=data, ax=ax)

plt.show()

Total running time of the script: ( 0 minutes 13.126 seconds)